Developing a system #8 (Three line break fofo strategy)
Submitted by Edward Revy on November 5, 2008 - 11:51.
Submitted by dr.fawwaz
A simple but powerful strategy but needs improvement for exit and take profit, sometimes it will have losses(very few) but all in all u will always be in profit, I'll describe it here and lets all improve it and beat the brokers together, here it is:
It's called the three line break fofo strategy (i made it my self).
Open a 15 min chart eur/jpy (u can use other currencies also but i like this currency) then let your chart type be THREE LINES BREAK INSTEAD OF CANDLESTICKS, that's all what u need, no indicators at all just the plain chart.
Read entire post >>>


hello, iam the one who submitted this strategy, iam dr.fawwaz, i mean three line break candles not the three line break indicator, u can find this three line break candles in fxsol broker's accucharts. thank u. they have free demo
Hi everyone,
I recalled I knew where to get the real 3 line break charts, not the indicator, so I went and compared those charts to custom made mt4 indicator: 3 line break.mq4
The result is:
Actual 3 line break charts work differently, they don't paint each candlestick.
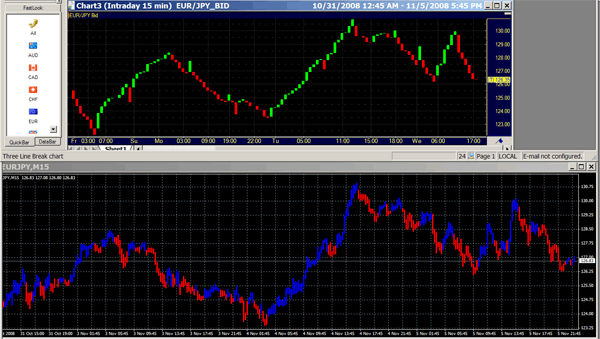
On the screeshot, above is a real 3 line break chart for 15 min EURJPY from FxSolutions broker.

Below is an MT4 chart from IBFX with 3 line break indicator also on 15min EURJPY chart.
As you can see they are different.
Real 3 line break charts paint lesser blocks than indicator, which paints each candlestick.
Construction of a Three Line Break Chart
A Three Line Break chart differs from traditional chart types.
A Three Line Break chart consists of vertical lines ("boxes") connected to each other. The direction of the lines is drawn based on price movements. The time relation, trading volume and chart information such as high and low prices are not taken into account.
Three Line Break charts are especially useful for detecting changes in trends.
In principle, a new line is drawn when the price exceeds the previous price's high or low. If the price does not exceed the price benchmarks of the day before, no line is drawn.
For a "Three Line Break", the same rule applies; however, after three lines of the same color, the price must reverse the amount of the last three lines to cause a trend change in the graph. Price movements that lead neither to a reversal nor to a line of the current direction are ignored.
The number of lines taken into account for the break is given by the Reversal parameter. For short-term trades it might be smaller than 3, for long-term trades 4 or higher. The setting "3" is the default value that gave the method its name. Please note that the Reversal parameter gives the number of lines to be taken into account, not a fixed price value as for the related methods Kagi and Renko. Therefore, the price at which the trend change occurs in the chart is relative.
The time elapsed is unimportant for this kind of charting. The time axis is not linear.
With real 3 line break charts this simple trading strategy has got a potential.
Hope this helps,
Thomas
At first glance it seems to be an effective method, although not always accurate, of course, as all methods. I think "3 lines break" is not a chart type but an indicator that pains the candles (or bars, it is more visible on bars) blue or red (or the color you like). You can download this indi from here: http://www.4shared.com/file/52057780/1624b67c/ultimaforex-3-lines-break.html?s=1
I am curious how this indicator works, maybe I could write a program to test this method and find some sound exit and stop strategy for it. Perhaps the method of "System7" on this site could be applied, or the two strategy could be combined. (This method could indicate the entry point and direction, and "System 7" could define the stop and target?).
So does anyone know how this 3 line break indicator works exactly?
Can't quite follow what you mean by "chart type is three lines break" the only chart options most platforms have are
1)Candlestick chart
2)Bar chart
3)Line chart
It would be helpful if you could include a chart of your strategy for our understanding.
Thanx again
What charts (what broker) do you use?
I found some MT4 indicators called "3 line break", but they are not working as original 3 line break charting.
Post new comment