Complex trading system #23 (Hamilton Forex System)
Submitted by User on January 27, 2013 - 10:22.
Submitted by Ashur
Hello everyone, today I will be submitting the only system you will ever need to consistently succeed in forex without having to be on your computer all day. This system allows you to go out and have an extra source of income without having to worry about how you're going to make it in the forex markets.
A little about me:
My name is Ashur,I've been trading forex for almost 9 years, I'm currently 22 years old and forex is my life. It assures me that every billionaire dream that I've had is completely possible and very near. I am the creator of scalping system #11 (The center of gravity) that you will find on this site. After years of trial and error, I have finally figured out how to make it all work with out any stress. I'm still not filthy rich of the markets yet, but the system I have creator will make sure I will be very soon. I've blown numerous accounts and I mean NUMEROUS, but I learned a very valuable lesson every single time. The key is to NEVER GIVE UP! Anyway, I was planning on keeping this system to my self and perhaps selling it to traders, but something inside me told me to give it out freely. I feel that posting this system is the best way I could possibly help everyone reach their goals of financial freedom. I want to see everyone wealthy, happy and successful. Just remember one thing, if there's one thing you want in life, as long as you can imagine it, you will have it. Never let your dreams die!
Hamilton Forex System:
This system uses the Metatrader 4 hour chart and Oandas Daily chart.
Metatrader 4 hour chart
- Center of Gravity (3000,1,1.1618)
- Moving Average exponential(500)(150)(50)
Oanda Daily Chart
- Heiken-Ashi candles
- Starc (250,300)(100,150)
Download:
Indicator: gravity_center.mq4
Template: hamilton_forex.zip
BUY
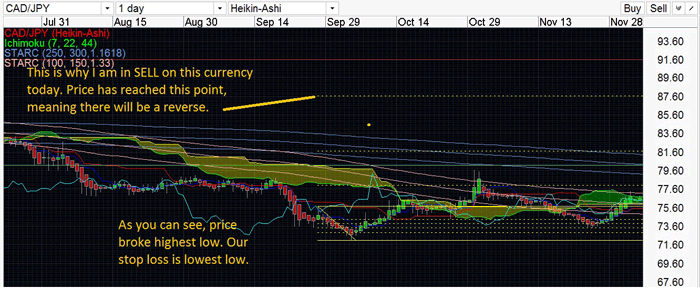
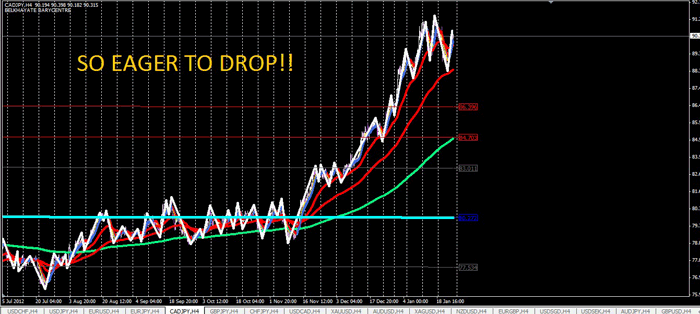
1. We look at our 4 hour metatrader chart. If moving average is all below the center of gravity, we are looking to BUY.
2. We then go to Oandas Daily chart, if price is below Starc bands we are good for a BUY.
3. We wait for heiken-ashi to form new low, we put a limit order at the high of the green heiken-ashi candle that was before the train of red candles.
4. Once order is filled, we put stop loss at the low of the red candles
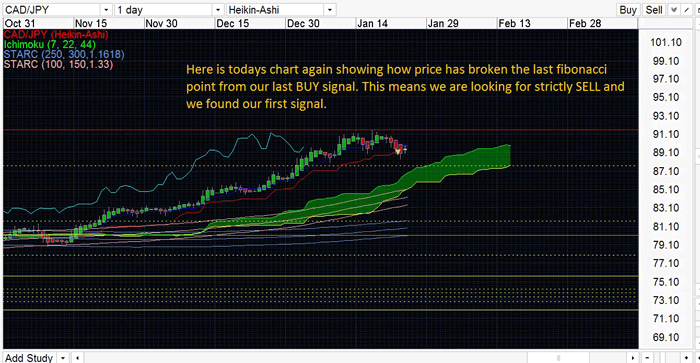
Take profit is determined by using fibonacci. You put the first point at the stoploss and the second point at the entry. Our takeprofit is the line furthest away. This is also our turning point, at this point we would begin looking for possible SELLS to form.
SELL
Sell is vice versa of BUY.
I have also posted the center of gravity indicator along with the template.
I wish a life time of success and happiness to everyone viewing this thread and I hope everyone will prosper well from this system.
****I also started a youtube channel that I constantly update with new video forecasts. You can go check it out and subscribe if you would like to be up to date with all of my latest trades and future trades.*****
https://www.youtube.com/watch?v=9cyK3juC2Fs
Edward Revy,
http://forex-strategies-revealed.com/
Copyright © Forex Strategies Revealed


?????Start trading at the age of 13?????
Hello Ashur, I have seen a lot of traders in my life and i have yet to see that one trader that made it to become consistently profitable (or a millionare,....or a billionaire) with all those indictors on a chart. Not trying to pull punches on your dreams here but especially in my case and many other cases i can tell you that its just not the way. We all know by now that indicators lag behind price (thats step #1) Actually a candle that is closing on whatever timeframe is also lagging price (Thats step #2), actually price forming on your chart is already lagging too (Thats step #3). Let me put it this way: If you and i are playing a game of tennis and we are standing straight ahead of eachother and i hit the ball from my right to your left,....where should you already be??? You see, we are all teached to follow, follow me, follow the trend, follow the indicator, follow the breakout etc. etc. instead of already being at that one place where price is bound to come back to.
it's hard to get the method , can u explain more? thank u
It is difficult to backtest this strategy.
Hello,
If you think have a good strategy and do not know to automated it in MQL4 just email me [email protected].
Below is one of my strategy which is automated
http://cubeupload.com/im/Xtrader/c2fTestresultmode1.png
http://s20.postimage.org/qsruzh2rx/Test_result_mode1.png
Nice to meet all.
Good grief, man, how do you see the candlesticks with all the "art on the chart"? It sure is pretty, but I'll stick with pure price action.
When you enter a BUY signal for example and then you see a SELL signal. This is telling you that the overall trend is BUY, but there is a minor SELL retracement that is going to take place. So in this case you can leave your BUY position OPEN as a long term trade and enter the SELL position to get those pips on the retracement.
Ashur
Hi Ashur,
For how long have you used this strategy in the live account?
How many trades can one have on yearly basis?
Thx.
-Tom
Ashur, congratulations on the hard work, and your willingness to share is appreciated. The system is fairly complex but the video made it easier to follow and set up. One question: Currently the EUR would be poised for a sell off...the 4H charts and the 1 Day chart all confirm it. What do you do if you put an order in to sell at the bottom of the previous red candle and when the price is very near, the 4H chart shows one or more of the MA's dip below the COG. Do you still allow the order to trigger? Thanks.
Hi Ashur,
Nice strategy.
One question, Suppose you go long in one pair, after some days/weeks I see sell signal, then in that case do I close the initial long trade or let it run as it is?
Thx.
-Tom
Post new comment