
How To Double The Account In 1 Day?
Submitted by User on September 13, 2015 - 23:04.
Author: Hassam
Forex trading can be fun if you can master the skill of risk management. In my opinion, the most important thing in any trade is risk management. If you risk 30 pips per trade and make 100 pips on average, even if you have a 50% winrate you will be making 350 pips in 10 trades ( 50% winrate means in 10 trades you win 5 trades and you lose 5 trades on average. Winning 5 trades means making 500 pips and losing 5 trades means you lose 150 pips so you make a total of 350 pips).
There is a no 100% winning trade setup. Every trade setup has a probability of failure. When you enter into a trade, you are taking the risk. With a small risk you ensure that if the trade setup fails you will not lose much. The trick lies in entering small and testing the waters. When the trade moves in your favor and you become pretty sure that you have caught a good move, you should open more positions. This will ensure that you multiply your profits manifolds. The important question is how we do it. I use candlesticks a lot in my trading. H4 candle and H1 candle are very important and they can give you very important clues where the price is going and where you should place the stop loss. I don’t bother about M5, M15 but use M30 candles as well as H1 and H4 candles in making my entry and exit decisions. I only open a trade at the close of M30, H1 or H4 candle.
All indicators are lagging and unreliable. The most reliable indicator as said above is price action. In the screenshots you will see Stochastic and MACD oscillator. I use them only 30% of the time while the use candlesticks 70% of the time. Moving averages work as strong support and resistance levels. I use moving averages as support and resistance levels.
This is precisely what I do. As I said above I look at the candlesticks 70% of the time and make my trading decisions. I use the candlestick high and low as stop loss levels also. So as a trader you should focus on price action much more than the indicators. Using price action solely is also known as Naked Trading. The shape of the candlestick can give you very important clues what the market is thinking and where the price is going to hit next.
This is what I do. Every morning, I first look at the Daily Chart. The daily candle shape, high, low open and close tell me the most probable shape of the daily candle that will be formed that day. Once I have analyzed the daily chart and make my mind in which direction the market will move, I then look at the H4 chart for possible entry signals. I only enter into a trade at the close of H1 candle or H4 candle as I have said earlier. Sometimes I also use M30 candles but I never use M15 or M5 candles. The shape of H4 and H1 candle is very important when making the entry and exit decisions. With practice you will know when to enter and exit the market. Daly the first thing that I do is look at the economic calendar of the day. You can use Forex Factory and Daily FX economic calendars. The time of each news release is important as near that time you should expect volatility.
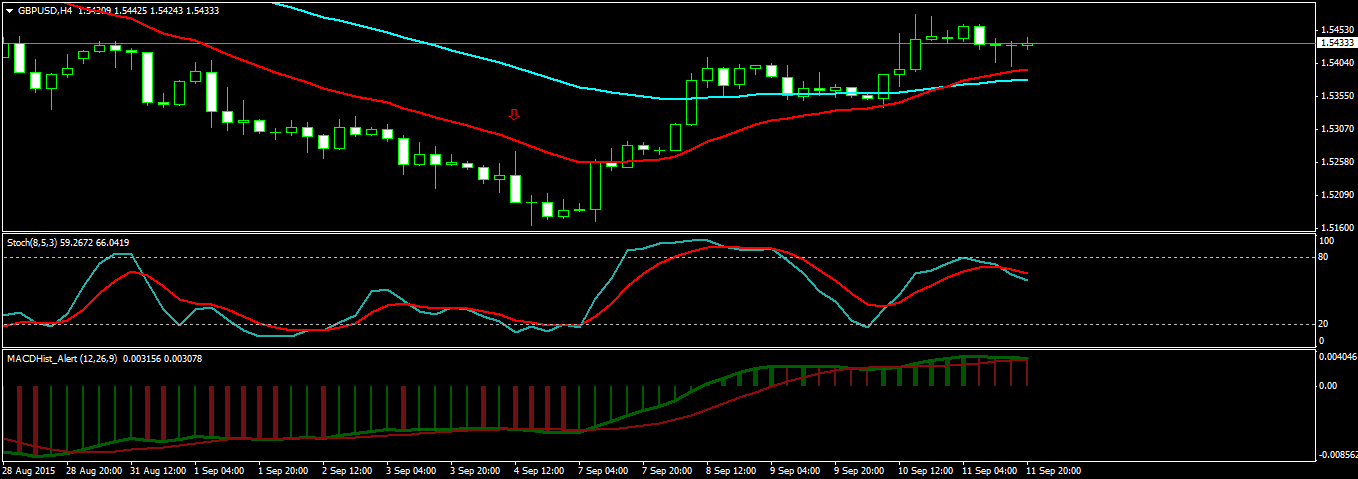
Below I explain in detail how to double your account in 1 day. This is a recent trade. On Friday was the NFP Report release. The red arrow in the screenshot below shows the H4 candle formed after the NFP Report release. You can see price first went up made a high and then fell. The closing price is the same as the low. This is a bearish candle. When the close and low are the same, you should expect the price to go down more as this indicates downward momentum. I close the charts for the day.
On Monday morning I open the charts again. I live in a timezone where London Open is at 11: 00 AM so fortunately I don’t have to get up at the night to trade the London Session. The New York Open according to my local time is 5:30 PM. By 11:00 PM local time, the New York market also slows down. GBPUSD makes the high or low for the day between the times 2: 00 AM EST and 5: 00 AM EST which translates into 11:00 AM and 2: 00 PM local time for me. You should keep this important fact in mind if you want to trade GBP pairs like GBPUSD, GBPJPY, GBPZNZD etc. Once GBP pairs find the high and low between 2; 00 EM EST and 5: 00 AM EST, it trends in that direction for the day till the next day until and unless there is a very important news release which is only the FOMC Minutes release which happens only one time in the month. This means when a trend starts on GBP pairs it only reverses next day except only one day of the month which is the FOMC day.
However EURUSD is different. I have found with experience that EURUSD loves to make good moves at the close of the New York market sessions and the start of the London Market Session next day. Keep these facts in your mind. Two important news releases are the NFP Report and the FOMC Meeting Minutes. These 2 important news releases can start new trends on GBPUSD and EURUSD.
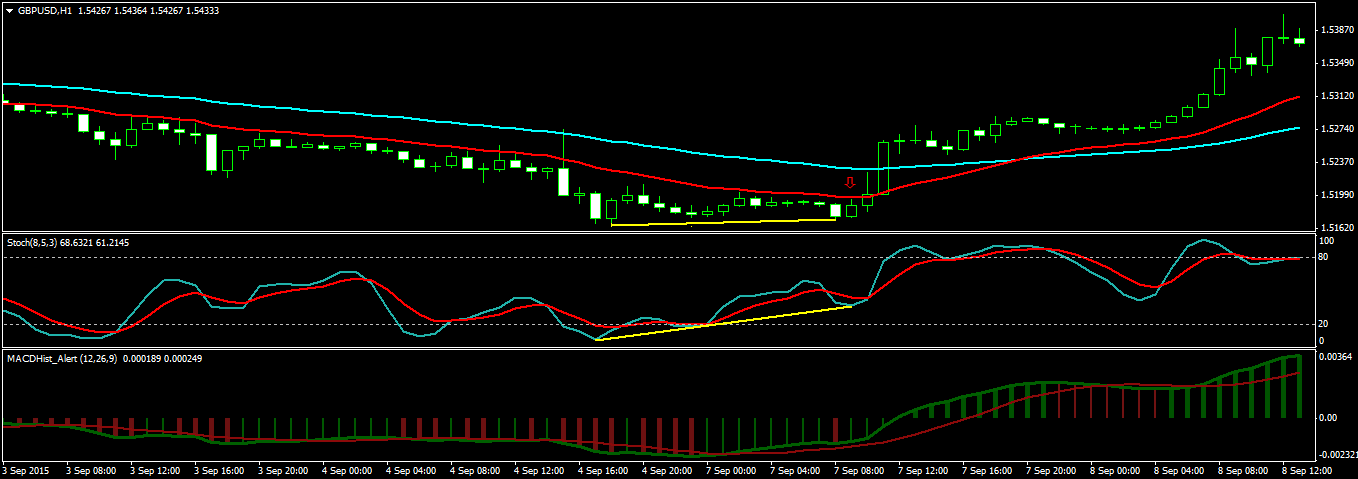
Let’s get back to our trade. On Monday I opened the charts, and take a look at the chart above. A bullish divergence pattern is forming on H1. We don’t need any indicator in fact. We can spot a double bottom pattern which is an important trend reversal pattern. I enter into a buy trade at the close of the H1 candle which is bullish. My entry price is 1.51879 and the stop loss is 1.51650. The risk is 22 pips. I have $1000 in my account. So I enter with a lot size of 0.1 lot which gives me a risk of $22 which means I am risking 2.2% of the account on this trade. I wait for the next H1 candle to close.
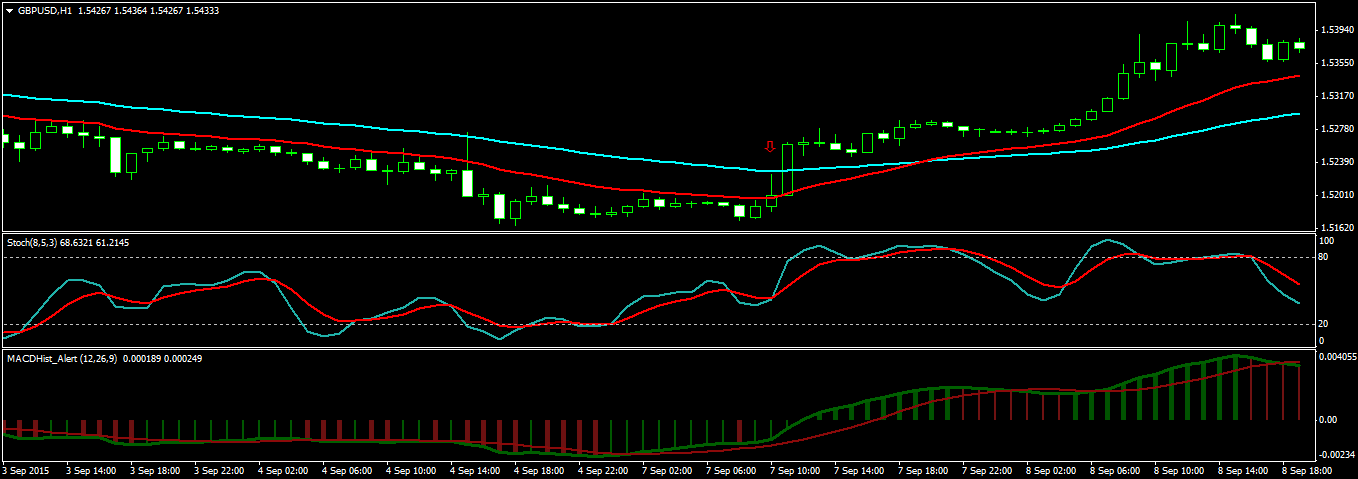
As I have said above I only open a new position at the close of H1 or H4 candle. This H1 candle just below the red arrow in the above screenshot is also a bullish candle. Which means that price is going to go up and the next H1 candle will also be bullish. So I open a new position at 1.52006 with 0.1 lot and move the stop loss to 1.517900 which is 2 pips below the low of this candle. The risk is now 9 pips for first position and 21 pips for the second position. So the total risk is 30 pips. Our total risk is only 3%. If the stop loss gets tripped we will lose $30.
But the shape of the 2 bullish candles show that the third candle will also be bullish. You can see in the above screenshot that the next h1 candle is very bullish. It is a strong Marubozu which means price is showing strong upward momentum. Marubozu candle means strong price momentum. Since this Marubozu is bullish it means price is going to go up strongly.
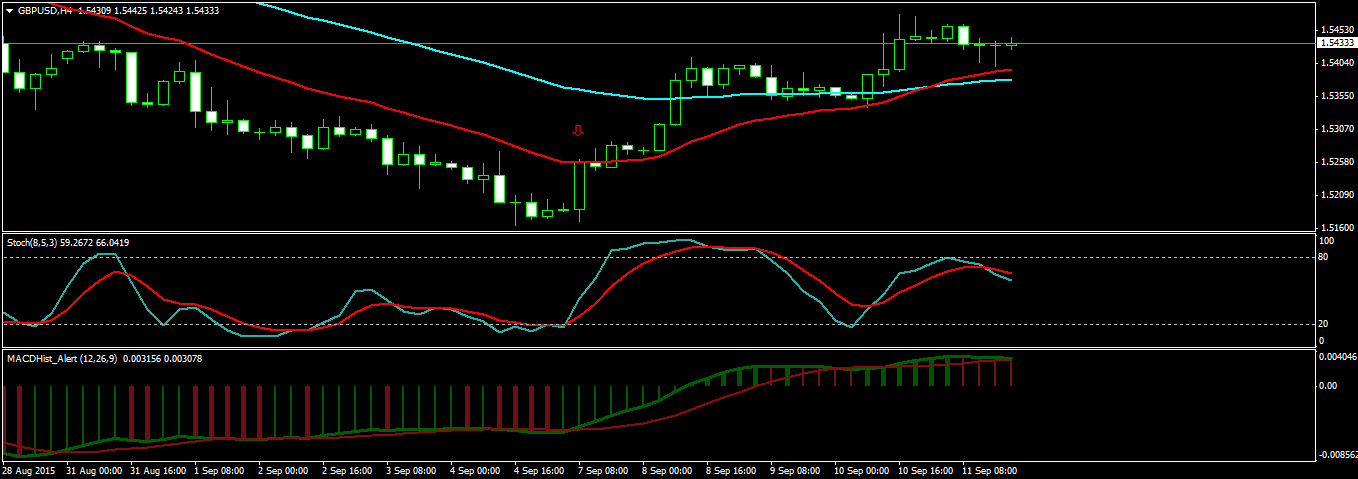
The above screenshot shows just below the red arrow the H4 candle that has been formed. This is a big Marubozu means price has strong momentum. I close the charts now knowing that the price will trend in the upward direction till the next day. The uptrend has been set in motion by the NFP news release last week on Friday. This is Monday and there are no news releases scheduled for today. So I expect the price to keep trending in the up direction. Next day morning I open the charts and first thing look at the daily chart. Take a look at the following daily chart.
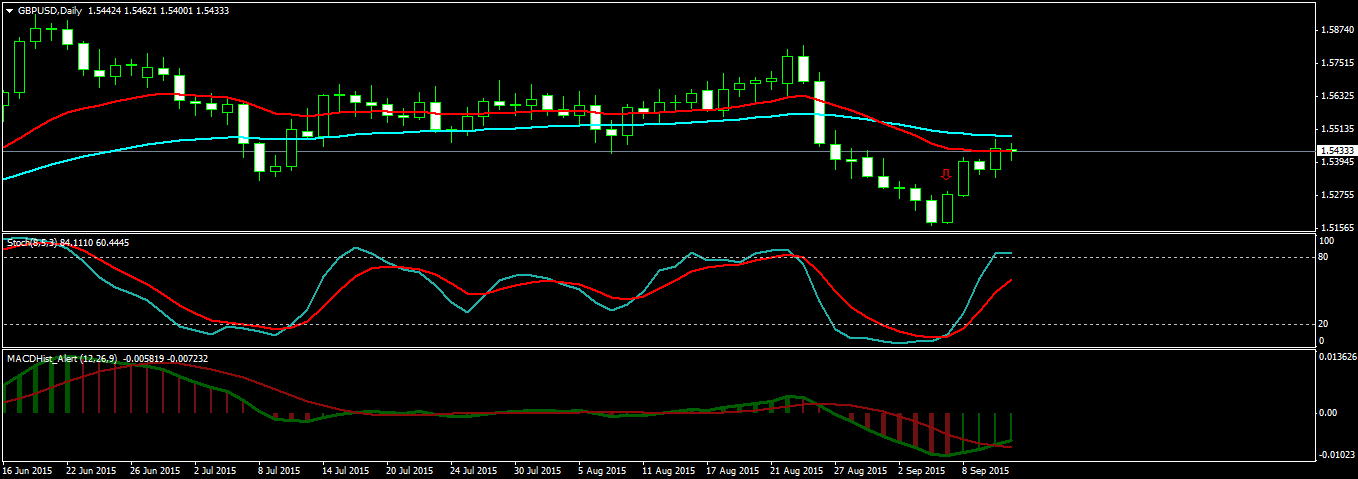
Daily candle formed is a strong bullish candle (below the red arrow). I know that price is go up today as well. Price is hovering at 1.52763. There is a profit of 89+73=162 pips. I open one more position at 1.52763 with 0.3 lot and move the stop loss to 1.52663 which is 4 pips below the low of this H4 candle. The risk is only $30 for this position. If the stop loss gets hit I lose 20 pips and the profit is still 142 pips. I look at the h1 chart and find that the whole night price has been moving in a narrow range which means a breakout in the upward direction today.
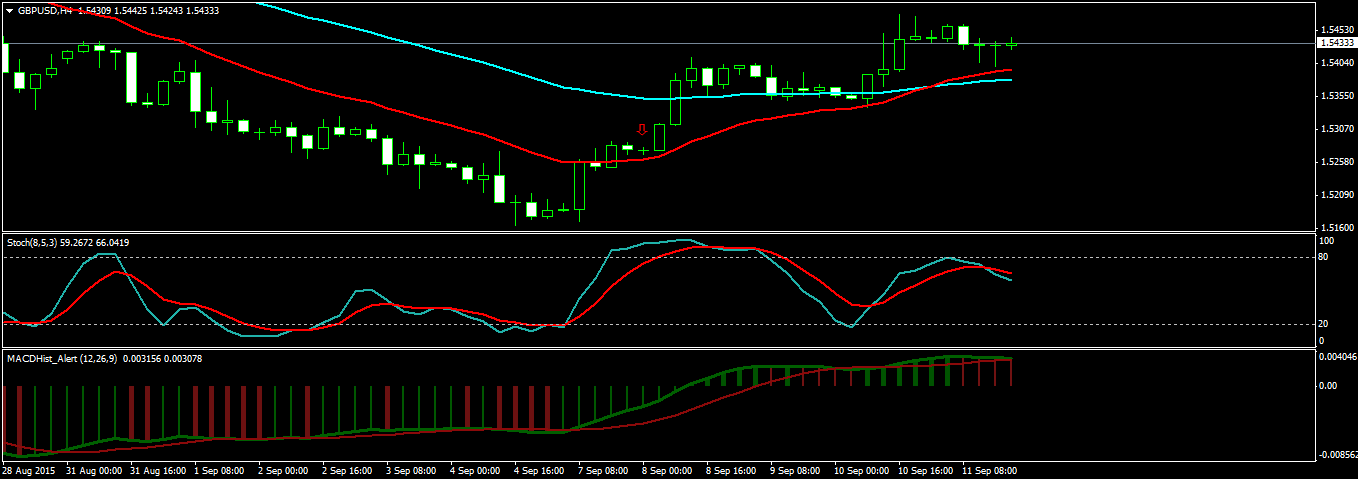
You can see the above screenshot showing H4 chart. The whole night price has been moving in a narrow range. The h4 candle just below the red arrow is a doji meaning the open and close prices are almost the same. This h4 candle is inside the previous h4 candle which is a trend continuation signal. The low of the previous h4 candle is 1.52694. I open a position at the close of the H4 candle just below the red arrow at 1.52763. The stop loss is at 1.52663 which is just 10 pips in this case. I open this position with 0.3 lots. The risk is $30 but since the first 2 positions have a profit of 162 pips I am more than covered in this case. If the stop loss gets hit I make 132 pips which is not bad.
The next h4 candle is again bullish. The inside bar pattern spotted in the morning was indicating an up move which is confirmed by this bullish h4 candle. I open one more position at the close of the H4 candle. The entry is 1.53145 move the stop loss to 1.52763 which makes the first 3 position risk free now. The risk for this position is now 39 pips. Since the profit from the first 3 position is 162 pips even if the stop loss gets hit this profit is guaranteed now. We close all the position after 8 hours at the close of H4 candle above the red arrow in the screenshot below. The closing price is 1.53961.
The profit is:
First position (0.1 lot) =209 pips
Second position (0.1 lot) =196 pips
Third position (0.3 lots) =360 pips
Fourth position (0.1 lot =82 pips
The total profit is 847 pips which translates into $847. The return is 84.7% which is not exactly 100% but I have used this strategy to double the account many times in just 1-2 days. In the beginning we had a risk of 3% but once the trade moved in our favor we had a totally risk free trade. You can read more examples of this strategy below:
http://www.doubledoji.com/double-in-a-day-forex-strategy-makes-100-retur...
http://day.tradingninja.com/double-in-a-day-forex-strategy-that-makes-10...
http://swing.tradingninja.com/recent-gbpusd-swing-trade-that-made-100-ga...
Read this post where I explain in detail how to use EMA21 and EMA55 as dynamic support and resistance levels:
http://www.doubledoji.com/how-to-use-ema-55-and-ema-21-as-dynamic-suppor...


Hi Hassam,
Thank you for the clear explanation with screenshots etc.
I'll study it carefully.
Regards,
JohanW
Post new comment