Complex trading system #20 (Multi-timeframe Market Analysis)
Submitted by User on September 6, 2011 - 00:04.
Submitted by Crystal Markets
MULTI-TIMEFRAME MARKET ANALYSIS
Two days ago, a former colleague at my former employment visited me, this time as a student. Having attended several seminal and read so many books needed to know a better way to trade with profits and consistently. I asked if he has a trading system or will have to buy from one of mine. He got one and he explained the setup to me and I found the problem with it.
He was trading the cross of the 14 and 7 SMA in the 1hour timeframe. He shared his DEMO account with me and I studied it and found inconsistencies. Knocked-out with market noise most of the time. I decided to help him fine-tune his trading plan and
I came up with the information below.
Successful trading - you need to have a good understanding of Trend in at least 3 different timeframes. One for the Major Trend, the second for counter trend (retracement) and the last one for entry and exit.
INDICATORS
- 14 and 7 SMA
- Default Parabolic SAR
- Fisher
All in Daily, 4hours and 1hour timeframe
DOWNLOADS:
TREND
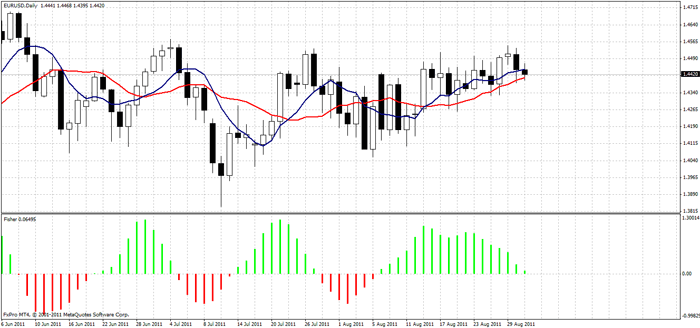
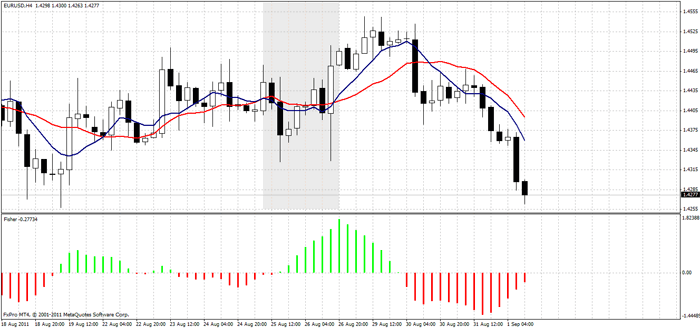
Your trend is in the Daily timeframe. BULL trend when the 7SMA is above the 14SMA in the daily timeframe. Your counter trend or retracement is in the 4hour. A counter BUY is when the 4hour is saying SELL. That is when 7SMA is below the 14SMA in 4hour timeframe when the Daily is still BUYING.
BUY SETUP
The chart of daily timeframe below shows a BUY because the 7SMA blue line is above the 14SMA the red line.
When the trend is determine, it’s good to wait for a retracement or counter trend in 4hour timeframe so you wait for SELL trend in 4hour when the BUY trend still remain in Daily timeframe. The 4hour chart below shows a counter trend.
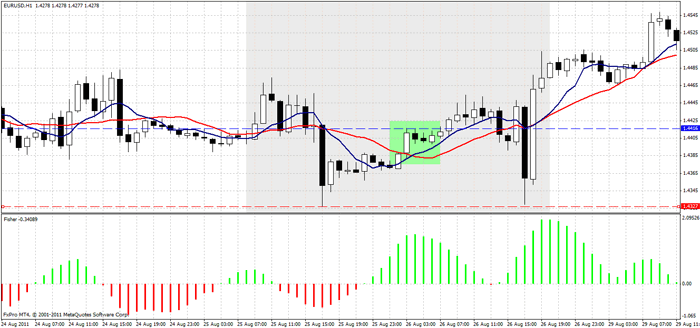
Now we watch the 1hour timeframe for entry. You want to trade BUY when 7SMA is above 14SMA. Obviously you will have several BUY noise in this timeframe, but the one you want to trade is the BUY at the point where Fisher 10 of 4hour is green. Like the 1hour chart below:
Your stoploss is the lowest Low and you can figure out your take-profit as same pips with Stoploss or more or depending on your risk plan.
Now do you have your favourite indicator and you need the right combination of timeframe to better maximize your use of them,
then visit http://crystal-markets.blogspot.com/ for details or contact [email protected]. The character of the indicator will help in selecting the right combination.
Edward Revy,
http://forex-strategies-revealed.com/
Copyright © Forex Strategies Revealed


I need good mentor to assist me.
Hi, I've found this to be a brilliant strategy, thanks for sharing it so selflessly. I've tested it on demo and took 3 trades and my account is up 5.2%. It's pretty good for barely a week's work! Thanks agn.
I have a question if you can help. I notice that the MA on H1 timeframe tends to cross in the direction of the D1 trend much earlier than H4 Fisher turns green/red. Therefore, if I wait for H4 Fisher to turn, then it's often too late going back into H1. Is it deliberate in order to avoid false signals? Appreciate your feedback. Thanks!
MacD To be above zero plus slope to be upwards on daily chart.Then watch dip on hourly chart and buy when large lower shadow candles appear.
I use momentum on RSI and bollinger t identift the trend
Use Fubonacci and Pivot to find support, resistence level
And Last, the reversal candelstick to comfirm the tarding signal
http://www.trade.moigioiforex.com
Crystal Trend as an important update here: http://crystal-markets.blogspot.com/2011/07/crystal-trend.html
Hello, Please i will also appreciate the poor post. I need it to get better please.
Crystal Markets
Hello guys I've lost so much that i gave up pls all i need now is a mentor....HELP PLS!
Sam
Thank you very much for sharing this system with us. I will be demo trading it on a wide range of currency pairs and will attempt to execute every blatantly obvious valid setup, if it looks sketchy, I'll pass on the setup.
I'll try not to trade two highly correlated pairs at a time.
If it goes well, I'll post again on November 19 2011 and write about how it went.
If it goes poorly, I probably will not be posting, but drinking heavily from the bottomless tub of melted ice cream.
-el gato queso
What is your point English user?
Is English your first language?
The parabolic SAR was used by my friend in his old way of applying the indicators but in the refined way you dont need PSAR
Crystal Markets
http://crystal-markets.blogspot.com/
Hi,
Thanks for sharing the strategy. In the indicator list above, it includes the Default Parabolic Sar. But in your description, there's no mention of how to use it in the strategy ?
A sell sample today: http://crystal-markets.blogspot.com/2011/09/chfjpy.html
Post new comment