Complex trading system #14 (Pivots, SAR + EMAs)
Submitted by User on March 15, 2010 - 06:24.
Submitted by Raphael
Hi everyone!
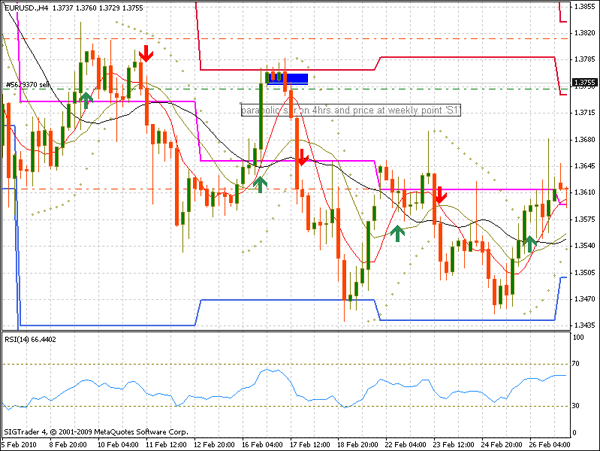
price at a weekly pivot point on 4hrs and a parabolic Sar indicates to anticipated direction, this is the only two clue I like to watch here.
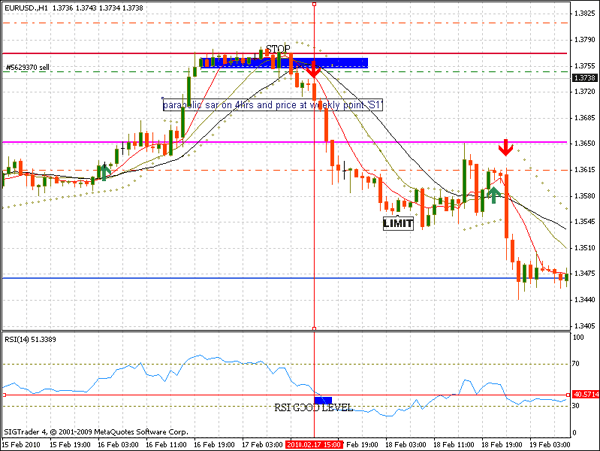
* Now, I will carry the microscope down to hourly chart look 3 ema crossover, in this explanation I will use 7, 14, 21 parameters depending on where the price is going. Let's take downtrend in this case:
OKAY ! LET GET STARTED
* price on a significant weekly point point on 4hrs and parabolic indicates down
* 7 ema crosses 14 ema and extends through 21 ema, this will manifest after the last cross I mean 7 cross 21 ema, and RSI is below 50 level not oversold.
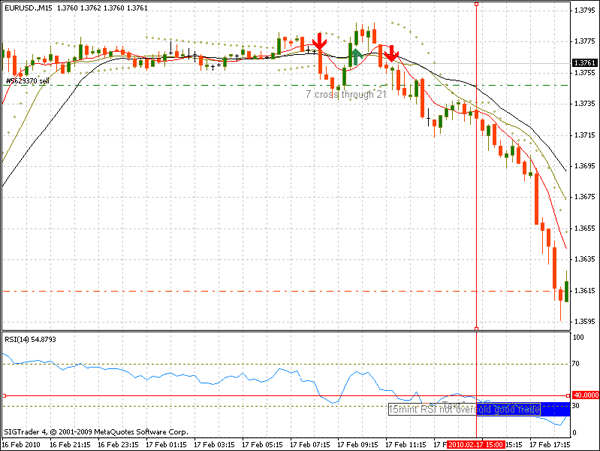
* The last thing I will like to do here is to carry the microscope much down to 15 mint and the only thing I will do here is to look for my default RSI and I make sure is not oversold.
Take profit and stop parameter
Take profit - like some pips before the next significant weekly pivot point
or
stay in until hourly parabolic Sar indicates to opposite direction in this case until parabolic Sar indicates to an uptrend I have chart below that will explain more
Stop parameter - some pips above that significant pivot that made you to go for the trade.
raph_matty1981(at)yahoo.com
Ibunkunoluwa Raphael.
Edward Revy,
http://forex-strategies-revealed.com/
Copyright © Forex Strategies Revealed


To calculate weekly pivot points we use Monday to Friday data.
In that range we need to determine the same values: High, Low & Close.
After that it's the same formula to calculate the pivots:
Pivot Point = (High + Low + Close) / 3
Resistance:
R1 = 2 * Pivot — Low
R2 = Pivot + (High — Low)
Support:
S1 = 2 * Pivot — High
S2 = Pivot — (High — Low)
Best regards,
Edward
how do i calculate the weekly pivot
I thought well have a deal that we haven't execute !
i thought you will let me know as soon you're throw with the EMA
raph_matty1981()yahoo.com
Good! i like this my friend let me know as soon as you are through.
Well, some of my findings with my E.A.. It did not go so well at first with very mixed results. However, after I added the momentum indicator on the 4 and 1 hour time frames, it is doing very well. It now has recovered the early losses and is ahead. I will know more after it runs for a few more weeks. It has a lot of potential for sure. I'm debatingchanging the parabollics indicator for the custom Gann high low indicator. As the program is doing very well now, maybe I better not fix it if it is not broke ha? I will report back later.
Jeff jeffk53(at)comcast(dot)net
They're exception to every rule i think every experienced trader would know that ,where your system would actually indicate one direction base on the information you got on your screen and one would'nt react to that believe me or not there some hidden part of every system that would not probably be known to people who never take much time to study any trading system, but like you said let me know if you got or not a good result from the E.A
am not using only mid pivot point
yes,you should consider where your candle close especially before condering a trade
i can't say 'YES 'nor did i say' NO'to your question because the cross might even be a bogus cross in the first place this are one of the hidden thing am talking about a trade must know when his system is pretending to be real.
Raphael Ebunoluwa.
Hi, couple of questions. Should the bar be closed before entering the trade?Are you using mid point pivot points? Should we consider what side of the pivot level the previous bar has closed? for example: The high of the 4 hour bar has touched R1, and the bar has closed below R1? If the close is above R1 and the 7 ema has droped below 21, do we still go short? I'm just asking if the close price should be on the side of the pivot point that matches the direction of the other indicators? I probably will go ahead and write an E.A. for this strategy and see what happens.
Jeff jeffk53(at)comcast(dot)net
Adewale ! i will like to hear from you if you really prefare where i refered you to.
Adewale ! i want to be nice enough with you ,you made me to remember those day when am still searching for how to trade with pivot point , i think you can find this link useful.
http://www.tradejuice.com/forex/pivot-point-trading-mm.htm
Ebunoluwa Raphael.
Hi Raphael,
I like this strategies combination.
I feel very comfortable with the strategy, but I want a detailed article to read on PIVOT POINTS.
Can you be of help to direct me to a link or a textbook. I will appreciate. Thanks..
Adewale.
like i explained above this is all about ema crossover the first thing is your hourly chart and is your comfirmation ,7 crosses over 21 ,parabolic sar in that direction and RSI below 5o level lets use down in this explanation
4hrs is your trend - price at a significant weekly pivot point parabolic indicates down dont forget we're using down trend in this explanation
15mint is your entry -base on you had filter price well from 4hrs and 1hr the only thing you need here is in this case of down trend your 15mint RSI must below 5olevel but not oversold that is your entry
and i think that answers your question
sorry my friend but what is the signal for entry? when we will enter the trade? can u explain plz
This Raphael ! anyone that thinks my analysis above is not clear please feel free to ask me anything concerning the strategy above and i will give you the best answer with no time but i think i had use the simplest way even the chart above to explain it.
iMho: Charts full with the indicators. Regards: Manus168
Hi Raphael,
thank you for sharing the strategy with us!
The link to the image wasn't found, unfortunately. Could you please re-upload it and post a link to it int the comment? Thank you!
Best regards,
Edward
Update: thank you for taking time to send the images!
Post new comment