
Complex trading system #13 (The Shark Attack System)
Submitted by User on December 28, 2009 - 09:31.
by Ashwani Gujral
Discovered long before there were stock markets, the Fibonacci method has proved to be useful for traders.
One of the key goals of stock market traders is to find a way out of the maze of the stock market. Toward this goal, traders have resorted to using astrology, rocket science, fundamental analysis, technical analysis, and more to achieve this goal.
The Fibonacci method is one such attempt to unravel the mysteries of the stock market, in this case by relating the market's movements to the Fibonacci series. Fibonacci series were discovered long before there were stock markets, but they relate amazingly well to the stock markets and other natural phenomena.
Leonardo of Pisa, a 13th-century Italian mathematician better known by his nickname, Fibonacci, is credited with the creation of the Fibonacci series. The series has its first two numbers as zero and 1. You arrive at the remaining numbers by adding the previous two numbers. For example,
0+1=1
1+1=2
1+2=3
2+3=5
3+5=8
5+8=13
8+13=21
13+21=34
21+34=55
34+55=89 and so on.
Thus, we arrive at a series of numbers: zero,1,1,2,3,5,8,13,21, 34, 55, 89.
These numbers are related to each other by a ratio. Many phenomena in nature, science, and astrology can be explained by using this property of the Fibonacci numbers. Fibonacci numbers also have an interesting relationship with each other. Using the sums from the examples above, we get 21/34 = 0.618; 34/55 = 0.618; 55/89 = 0.618. Similarly, 34/21 = 1.618; 55/34 = 1.618, 89/55 = 1.618. This ratio is known as the golden ratio and forms the basis of the Fibonacci methods in technical analysis.
The other two fractions, 0.382 and 0.5, most commonly used in technical analysis are calculated as follows:
(1 - 0.618) = 0.382 and 0.5 is the mean of 0.382 and 0.618.
FIBONACCI RETRACEMENTS
Fibonacci retracement tools are conveniently available in most software packages. To use it, we must:
Identify a swing high and a swing low in the price action.
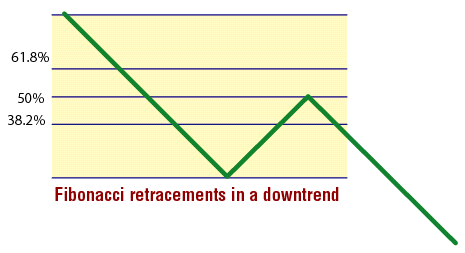
Generally, use the 38.2%, 50%, and 61.8% values (Figures 1 and 2). If those values do not hold, 25% and 75% can also be used.
Look for supporting evidence along with Fibonacci retracements, such as extreme values in short-term relative strength index (RSI) or stochastics, or confluence of Fibonacci levels across time frames.
Focus on regions of support and resistance.
In very strong bull and bear markets, look for prices that often do not retrace more than 25-38.2%. In moderately bullish and bearish markets, prices can retrace up to 50-61.8%.
Finally, keep an eye out if prices start breaking the 61.8% to 75% retracement. If this happens, the main trend may be under threat.
Figure 1: Fibonacci retracements in an uptrend
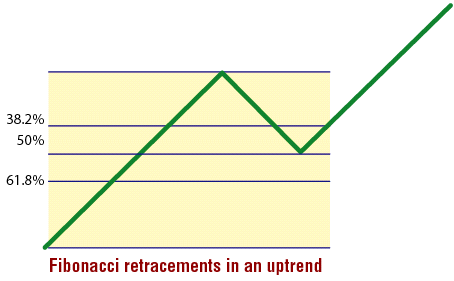
Figure 2: Fibonacci retracements in a downtrend
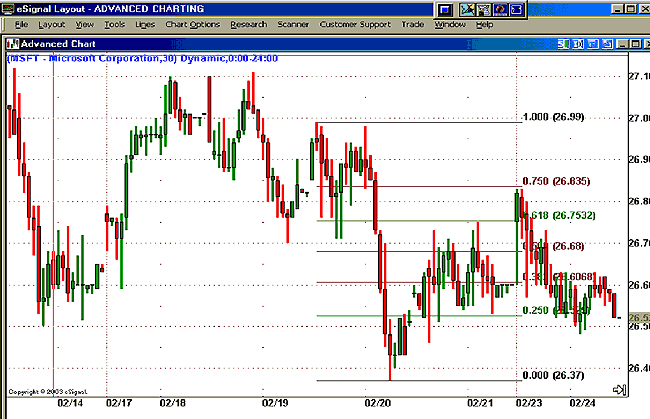
Figures 3 and 4 display examples of Fibonacci retracement levels in upswings and downswings.
Figure 3: Fibonacci retracement levels in an upswing
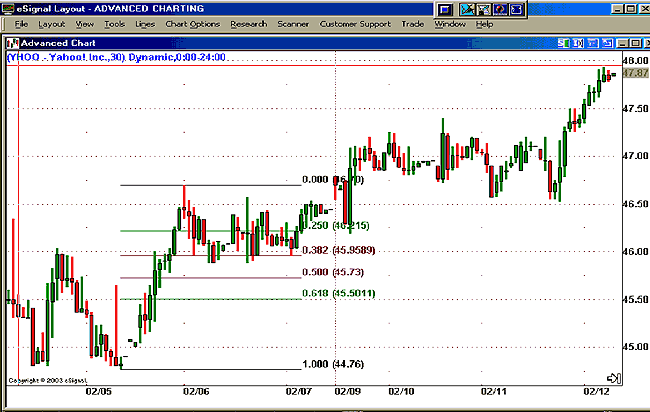
Figure 4: Fibonacci retracement levels in a downswing
CONFLUENCE OF FIBONACCI LEVELS
With almost five Fibonacci levels to contend with, traders can often be confused. They are often left wondering which of the levels might most likely hold. In such cases,
The confluence of two Fibonacci levels measured from two different swing lows to the same swing high in an upswing is considered the most significant support level.
On the other hand, the confluence of two Fibonacci levels measured from two different swing highs to the same swing low is considered to be the most significant resistance level.
When the stock gets close to a confluence level, traders should look for supporting evidence in order to act. Fibonacci levels like other indicators cannot be acted on in isolation.
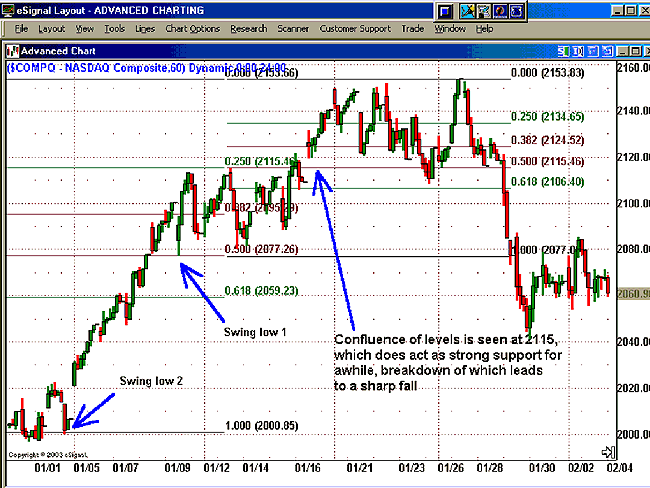
The 60-minute chart of the Nasdaq composite in Figure 5 shows the confluence of levels at 2115, which acts as a strong support.
Figure 5: Nasdaq composite 60-minute chart
SHARK ATTACK
Now, here's a strategy using the Fibonacci levels. The shark attack strategy details how retail traders are learning conventional, predictable theories in technical analysis and are not doing themselves any good. Haven't you seen it happen?
Think of it. Whenever you position yourself for what you believe is a sure traditional setup, smart traders and institutions come in and move the market sharply in the opposite direction, coming in for the kill, much the way sharks do instinctively. In this, the shark attack is similar to the turtle soup strategy made popular by Larry Connors and Linda Bradford Raschke in their book, Street Smarts. That strategy is another example of how smart traders and institutions take advantage of retail traders using traditional setups who become trapped on the other side of the trade.
If you become aware of how the shark attack strategy works, you can avoid the consequences. Here's how the shark attack strategy can be used with Fibonacci levels for both short trades and long trades:
Conditions for the short trade (Figures 6 and 7)
Assume the market is in an upswing and forms a swing high point 1, retracing normally to point 2. I wait for the market to test the previous top. Two possibilities arise:
1 The market forms a double top and comes down sharply.
2 The market breaks the previous top and continues to rally to point 3.
Figure 6: Short trade shark attack

Figure 7: Short trade shark attack
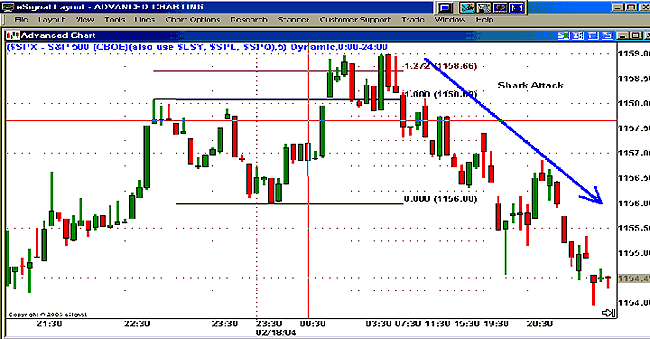
The third possibility is the shark attack that is, the market breaks its previous top and rallies between 1.272 and 1.618 of the previous correction, which is point 3, and retail traders go long with it.
After this, a sharp decline takes place, taking the market down to at least 1.272 of the last rally. At that point, pressured retail traders scamper away, and should prepare for shark attacks whenever traders act in a bullish or bearish consensus, expecting a breakdown or breakout.
The short trade can be taken when the low of the previous bar is broken and the second higher high can be used as the stop-loss. The profits on the short side can be 1.272 times the difference of point 3 and point 2.
Conditions for the long trade (Figures 8 and 9)
The converse is true for the long trade. Assume the market is in a downswing and makes a swing low at point 1, and retraces upward to point 2. You should wait for the market to test the previous bottom. The market could either form a double bottom and rally sharply or break the previous bottom and continue to decline to point 3.
Figure 8: Long trade shark attack
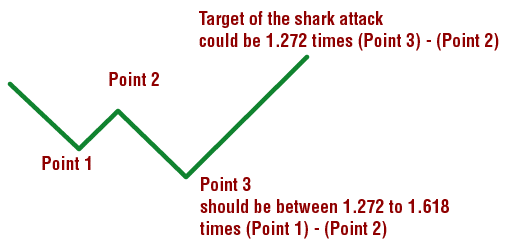
Figure 9: Long trade shark attack
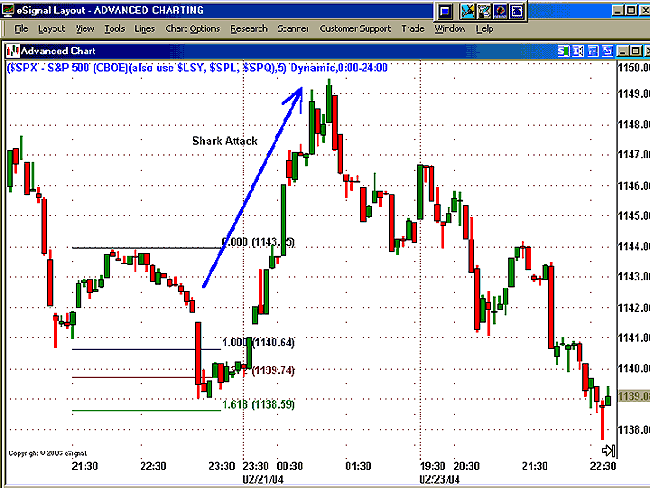
Once again, another possibility is the shark attack, which occurs when the market breaks its previous bottom and declines to about 1.272 and 1.618 of the previous correction (point 3), making retail traders go short with it. After this a sharp rally takes place, taking the market up to at least 1.272 of the last correction, as once again, pressured retail traders scamper away and cover their short positions.
The long trade can be taken when the high of the previous bar is broken and the second lower low can be used as the stop-loss.
In both the long and short trades, traders must tread with caution on the simple breakout/breakdown trades and should be ready for shark attacks whenever retail traders act in a bullish or bearish consensus expecting a breakdown or breakout.
Thank you.
Ashwani Gujral is an India-based technical analyst, commentator, author, and trainer. He follows both Indian and US markets. He is an active short-term trader and money manager.
Website - www.ashwanigujral.com
Edward Revy,
http://forex-strategies-revealed.com/
Copyright © Forex Strategies Revealed


this is mot good any traders dont belive this tipe srategi
i don't think its not a very power full system.. they did not tell about the main trend ... Fibonacci is a power full tool.. no doubt about that... BUT WE HAVE TO USE WITH THE ORIGINAL MAIN TREND... KEEP IN MIND ALWAYS TRADE WITH THE TREND....
BULL SHIT TRADING PRINCIPLE. Please understand giving an abstract equation or a numeric relationship and connecting it with a trade floor without investing own money and advising people is nonsense and listensing to such so called IIT/ IIM / Harward Gurus is foolish.
If they are great in their subject and can advise on uplifting the world from economic slowdown and giving equation to make fat income monthly will help everyone in this world happy and rich.
DO NO LISTEN TO THIS SO CALLED MENTORS
breath taking strategey ! any yes it realy works :)
thanks so much for sharing
you can't explain bear flag / bull flag better than. now i have two targets for flags. thanks very much for sharing.
I'm confused here. you said
"Whenever you position yourself for what you believe is a sure traditional setup, smart traders and institutions come in and move the market sharply in the opposite direction" but where does this apply? at point 3? if so, for both pictures are people expecting the move in the direction you are saying????
TELL US SOMETHING WE DONT KNOW.. I HATE THESE GUYS WHO POST THEIR WEBSITE AND NAME .. SOUNDS AND SMELLS SO MUCH LIKE THESE GURUS WHO AREN'T TRADING THEM-SELF..BUT TEACHING TRADERS THEIR TRICKS AND CLASSES .. LIKE A TEACHING SOMEONE HOW TO DRIVE BUT HE HAS HIT EVERY CAR TO THE WALL HIMSELF...
What a stretegy! I actually stumbled on this strategy by myself after analyzing but never understood what to expect of 3. you've made my trading a whole lot clearer! Thanks!
harmonic trading you mean?
Post new comment