#5 Slope Directional Line ++
Submitted by Edward Revy on October 26, 2008 - 11:39.
A new strategy from Manus168. Happy trading!
Hi;
I want to share some strategies for Custom Indicators MT4.
The Setup:
Only use Timeframes: DAILY Charts ONLY! (Please Don't use on a smaller Timeframe such as H4, H1, m30, m15,...etc)
Currencies: Any (but preferred is EUR/USD).
The Indicators are:
1. Bollinger Bands (Period 20, Deviation 2).
2. Bollinger Bands (Period 20, Deviation 1).
3. RSI (4).
5. Slope Directional Line (15).
6. Slope Direction Line (10).
But don't you worry; you just open the templates all the setup required will be ON.
The Good Thing with this system is, if the Market moves Sideways, Price will be moving from Upper to Lower Bands but if the Market is Trending, the Price usually just move only in the Lower Channel Bands (Between Deviation 1 & 2) in Downtrend Market or move only in the Upper Channel Bands (Between Deviation 1 & 2) in an Uptrend Market.
ENTRY
For the Trending Market:
BUY:
1. If Price enters the Upper Channel Band by piercing Deviation 1 Bands or if price already in the channel suddenly touches the Deviation 1 Bands of the Upper Channel.
2. RSI (4) is above Level 50 or if the Break of the Trendline in the price & Trendline in the RSI is confirmed.
3. Both Slope Directional Lines (10 & 15) change or still in the same Blue Color (both of them).
If all 3 Criteria has been fulfilled, the Next Opening Day we will open Buy Position. (Remember we just only enter the next day after the 3 Criteria has been completed!)
SELL: Reverse of the Buy SetUp. Both SDL (10 & 15) must be of the same color: Red.
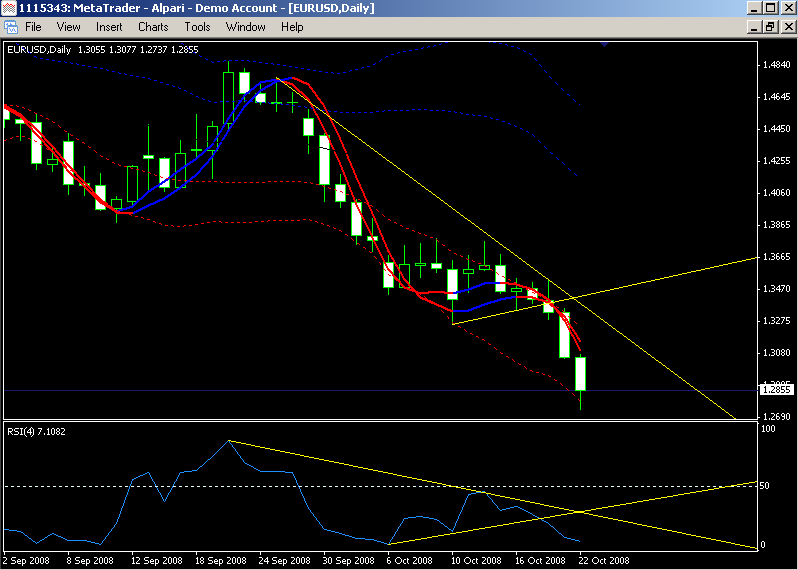
Here's the Screenshot1 with the RSI(4) & Trendline:

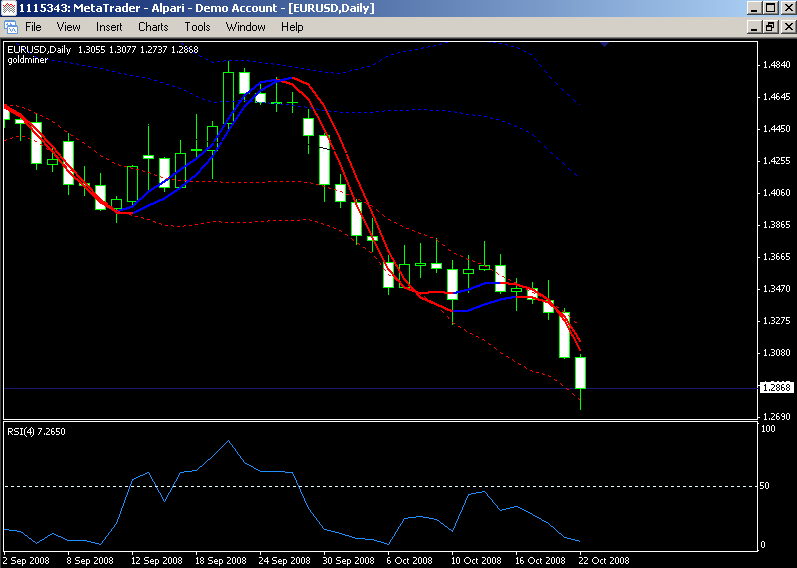
& this is the Plain Screenshot:

ENTRY
For the Sideways Market:
BUY:
1. Price at the lower Band Channel suddenly Break the Lower Channel Deviation 1 & the next day if the opening price still above Lower Channel Bands Deviation 1, we can take LONG/BUY Position.
2. RSI (4) above 50 levels or there is a Break of both TrendLines - in Price & RSI.
3. Both Slope Directional Lines must change to the same Blue Color.
If all 3 Criteria are met, the next Opening Day we enter BUY position.
SELL: The reverse of Buy SetUp. Both SDL (10 & 15) must change to the same Red Color.
Stop Loss: (there are 2 alternatives).
1. Put at the Swing Low (Buy) or Swing High (Sell).
2. Put at Previous Bill William Fractals & if the Fractal Moves, apply a trailing stop alongside it.
EXIT:
1. if The Price move in our favour 1 times the amount we risked, we cut 1/2 position, & for the other 1/2 we put the Stop Loss to Break Even & the next day we can trail the Stop by the 3 Day Lowest Low - 0.1% (For Uptrend) & 3 Day Highest High - 0.1% (for Downtrend)
Below are the Indicators & the Templates you can Download:
I wish the best for us.
All The Best;
Manus168
attachment:
Edward Revy,
http://forex-strategies-revealed.com/
Copyright © Forex Strategies Revealed


pls I am looking for a comprehensive definition of directional line.
This system works well in a trending market, but will kill you in a ranging market. I suggest to establish the trend better first, just looking at short SDL and BB will not do this!. I myself have build custom MACD indicator that determines the trend by looking at long MACD (EMAs like 200,300...) histogram slope. This works fairly well and I like to use it in almost all of my systems.
Best Regards,
Jani
Hey Manus,
thanks for your strategy!
Do you have a picture where you put in what the different Channel types are?(like Diviation and so on).
I explained it to myself, but it would be helpfull to SEE it...
Also a stochastic iscillator is helpfull i found out..
Ghaz
Hi Ahmad,
The Bands theory is good. With it you can test different set of rules and indicators.
I haven't tested the system in live trading to provide any additional feedback. I'm very sorry, some systems have to be tested by other traders, because these days I'm not longer able to keep up with all of the strategies posted (the volume is too big for one man).
Kind regards,
Edward
Hi Edward , I am new over here
i found ur site amazing really
I would really appreciate if u can comment
on Manus186 strategy please
sincerely
Ahmad
Hi,
the quickest way to find out is to run it on 1 minute time frame.
Kind regards,
Edward
does it repaint?????
Hello Barret;
Please feel free to try in lower Timeframe (& tweak the parameter Indicators settings too), but Imho this strategy is preferred for Daily Timeframe.
Regards;
Manus168
Hi Barret,
Manus168 says above DON'T :) use any smaller time frames!
But, let's assume you want to run some tests, then you can probably add one more time frame, I'd use 1 hour or 30 min, where you'll be looking to catch a perfect entry time. Leave daily time frame to suggest main trend.
Rich
Hi Manus168,
Can this be used for intraday trading, say on 15 min t/f?
- Barrett
thank you
Post new comment