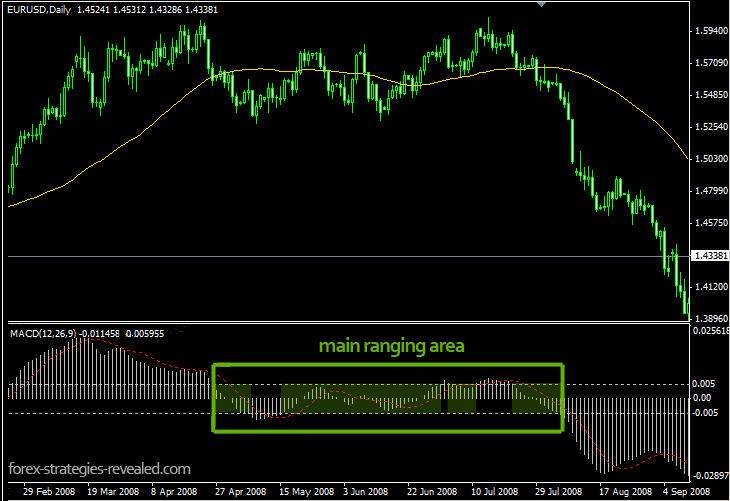
#2 Range-bound trading (MACD histogram range)
Submitted by Edward Revy on December 17, 2009 - 17:44.
Another simple way to detect a ranging market is to use MACD histogram.
Remember, that when we look back at historical charts, ranging and trending market periods are very obvious, but when we return to trading in live mode, often there are few clues about the time when the market actually starts ranging.
How a MACD histogram can help?
By simply adding 2 levels – upper and lower horizontal lines above and below 0 on MACD, you’ll mark areas most vulnerable to market consolidations.
On the screen shot below I’ve highlighted the main ranging area the way we’ll be able to see it after it was formed (useful for trading breakouts afterwards). BUT, inside that green area I’ve highlighted zones of MACD histogram trading in between 0.005 and -0.005 values – this is when we will actually be able to detect a ranging market as we trade in real time.

Two things to note:
a. If your platform uses 4 decimal piece quotes, you need 0.05 and -0.05. On the screen shot above I have 5 decimal quotes, so I’m using 0.005 and -0.005.
b. We can adjust/change MACD range-bound area levels to 0.003 and -0.003 or any other value you find most appropriate for your trading, but at the end, one thing remains true – MACD histogram hovering around its zero level suggests an area where we should expect some sideways activity.
Edward Revy,
http://forex-strategies-revealed.com/
Copyright © Forex Strategies Revealed


Hi
all the strategies i have tried to use both in trending and ranging market do not give me my desired result. what could be wrong?
bobby
cool tx
Sweet.....
You blessed me man thanks
Hi,
it could be any strategy. Basically you would consider it, when your trading strategy is vulnerable to price noise in the range-bound markets.
My goal was to give a methodology to identify those ranging conditions, so that you can adopt it to your trading.
Kind regards,
Edward
do you have trading strategy that works best with this signals
Hi J,
you should have one primary time frame to trade with. Let's say, you choose 4 hour TF.
This will be your only frame to judge about trends and ranges.
When it comes to entries, you can always rely on your 4 hour (main) chart signals, or, if you feel that you can get a better deal with a smaller time frame as the signal arrives on the 4 hour chart, you can scale down to 1 hour or 30 min frame and from there pick up the best Entry.
When it comes to exits, you should focus on 4 hours charts.
Best regards,
Edward
On the same pair you may receive a both range bound and non-range bound signals depending on which time frame you choose. If we are drilling down to a smaller time frame for entry/exits using a trend following system and we find the smaller time frame to indicate range bound activity, do we continue to use the trend following system or change to a range bound system?
Cheers
J
Hi Keith,
in fact, that's not a problem, you're correct in your observation.
On GBPJPY and on some other pairs too it won't be possible to use earlier suggested range level on MACD, therefore you need to define the new levels on your own by looking back at GBPJPY historical charts and marking periods of sideways activity.
Best regards,
Edward
Hello Edward,
Thanks for your sharing but i encountered a problem.
I spotted MACD with 2 levels 0.005 and -0.005 as you suggested( I have 5-decimal quote like yours) but with GBP/JPY daily chart, the value of MACD is usually much more greater than 0.005 and -0.005 ( the smallest is 0.1xx )and these two lines are very small and near to zero. Maybe i misunderstood you. Does 5 decimal quote refer to the pairs with 5 decimal like E/U, G/U but not G/J ( 3 decimal after the point) or it refer to the brokers that use 5 decimal to quote the price ( 3 for XXX/JPY) which differ from those use 4 decimal ( 2 for XXX/JPY)?
Thank you
Regards
Keith
Exactly, you won't see the whole rage, until it happened. But we don't need it, it's the past.
The key points are:
- as MACD approached the range area it'll be the first warning that there could be some sideways activity soon - it gives you first clues ahead.
- once MACD gets inside the range area, you can follow it and get an additional confirmation that the range isn't over yet. For certain strategies it can be quite useful.
Best regards,
Edward
Nonsense. Like you're gonna see it happen until it happened.
This is a great strategy. A real gem !!!
Thank you!
I like this simple visual confirmation. just another small trick to pull out of everyday trading tools.
Keep it up!
Post new comment