Forex trading strategy #30 (Leading Trading Strategy)
Submitted by User on January 27, 2010 - 20:12.
Strategy by Mennzz
Hi,
Here's a Leading Trading Strategy.
Hope you Enjoy!
--
Time Frame: Daily, Weekly, Monthly.
Currency: Most currencies are accurate.
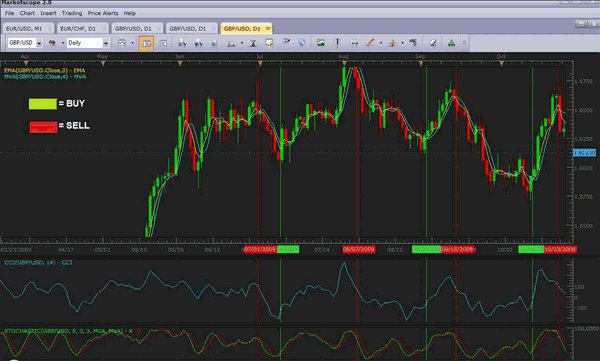
Indicators: EMA(3), MVA(4),CCI(14), STOCHASTIC(5,3,3).
Basic info: Enter a buy trade when the CCI line crossed the -100 mark, and the stochastics cross sooner or later, and the EMA-MVA cross sooner or later. Do the opposite for sell trades. Sell when the CCI line crosses the 100 mark......
This is a leading strategy, so it may give some false signals. Otherwise, its one of my best.
(Note: This strategy was back-tested for 1 month.)
Enjoy.
--
-Mennzz
Happy Trading!
Edward Revy,
http://forex-strategies-revealed.com/
Copyright © Forex Strategies Revealed


hi eddward,
can u show the picture of how to setup exit point in this strategy.
shakil
Hi Dennis,
MVA appears to be simply a Moving Average.
I think we have to ask the broker for clarification on this.
FXCM confirmed that on their Markescope platform VMA means SMA (Simple Moving Average).
Best regards,
Edward
Where can we find The MVA indicator?
Dennis
Thank you, Mennzz
I think, in order to hold it up together, and give a trade the room to develop, we should place our Stop below the swing that is corresponding to the lowest point of CCI before it hit the -100/100 level.
For exits I would, first of all, look for CCI to reach 0 level, where I would take out 1/2 of the profits. The rest will run till I find the next point to exit:
1. I would draw a trend line, preferably on CCI (by connecting peaks and valleys the same way we do it on price charts). When the CCI trendline is broken - it is time to exit.
2. Or, if it is not possible to draw a trendline on CCI as it approaches its 0 level (because CCI went vertical straight towards zero), then I would search for clues on the price chart, where, as a rule, I will see a strong steady advance taking place without retracements. In this case - my preferred exit will be based on the moving average (we can use 3 EMA here):
- when Long, as soon as candlesticks keep closing above the EMA - stay in a trade. Once the first candle closes below the EMA - exit. Opposite for the Short position.
2.a. If it was possible to draw a trend line on the chart, I would stick to it, and solve all the questions concerning exits: I will exit as soon as the trend line is broken by a candlestick that successfully closes on the opposite side of the trend line.
Best regards,
Edward
How do you figure out exit points?
Has anybody tried this strategy? I just started. It looks good
Thank you
A good filter for this strategy is making Sellstop or Buystop orders at the low or high of the day before..
MVA stands for Moving Average in Marketscope.
Thomas
"I don't know what MVA stands for but someone here may know."
How can you trade with a tool you don't understand?
Hi. The result was 81 percent profitable. I don't know what MVA stands for but someone here may know. -Mennzz
May I know what is the result you get after one month?
What is the MVA indicator
Dennis
Hi,
You can add a Regression(14) line and wait for the bars to close on the other side of regression with all the other signals. (The daily chart worked best in back-testing, although you can use weekly & monthly with success.)
Example pic below.
(This is the most profitable leading strategy you can find, so enjoy and Happy Trading.)
-Mennzz
Happy Trading.
Post new comment