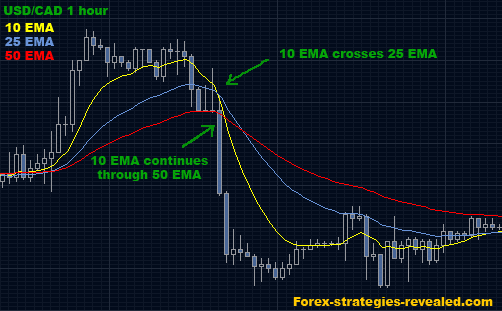
Forex trading strategy #1 (Fast moving averages crossover)
Submitted by Edward Revy on February 28, 2007 - 13:07.
Trading systems based on fast moving averages are quite easy to follow. Let's take a look at this simple system.
Currency pairs: ANY
Time frame chart: 1 hour or 15 minute chart.
Indicators: 10 EMA, 25 EMA, 50 EMA.
Entry rules: When 10 EMA goes through 25 EMA and continues through 50 EMA, BUY/SELL in the direction of 10 EMA once it clearly makes it through 50 EMA. (Just wait for the current price bar to close on the opposite site of 50 EMA. This waiting helps to avoid false signals).
Exit rules: option1: exit when 10 EMA crosses 25 EMA again.
option2: exit when 10 EMA returns and touches 50 EMA (again it is suggested to wait until the current price bar after so called “touch” has been closed on the opposite side of 50 EMA).

Advantages: it is easy to use, and it gives very good results when the market is trending, during big price break-outs and big price moves.
Disadvantages: Fast moving average indicator is a follow-up indicator or it is also called a lagging indicator, which means it does not predict future market directions, but rather reflects current situation on the market. This characteristic makes it vulnerable: firstly, because it can change its signals any time, secondly – because need to watch it all the time; and finally, when market trades sideways (no trend) with very little fluctuation in price it can give many false signals, so it is not suggested to use it during such periods.
Edward Revy,
http://forex-strategies-revealed.com/
Copyright © Forex Strategies Revealed


Thank you, everyone!
Comments for this strategy are now closed. To continue discussion, please use our Forex Forum, where you can create a new discussion topic.
I like to use previous swing high/low to set my initial stop.
You can add Bill Williams fractals indicator to help you with tops and bottoms.
Here is a SL method:
we use the latest swing high/low which is on the other side of our EMA cross (See initial stop loss levels on the screen shot below).
The next thing we need is a swing/fractal on the opposite side of EMA cross (highlighted as the "checkpoint").
We should not move our initial stop loss till we see the "checkpoint" level being surpassed by the price. Once the checkpoint is passed, move SL to the latest fractal. Repeat the steps.
Best regards,
Edward
Hi Edward,
Where shall I place the STOP LOSS?
Thanks.
Buddy.
The strategy will fail only when there is a truly narrow range which allows Moving averages to cross multiple times. You should be able to see this range far ahead and disregard MA crosses till price breaks out of the range.
Another trouble this strategy can encounter is quickly changing trends - a wide and violent sideways channel. In such cases it is better to switch to a higher time frame while on the smaller one use use RSI or Stochastic or CCI to anticipate tops and bottoms.
Regards,
Edward
THIS STRATGY FAILS IN SIDEWAYS MOVEMENT
You can tell that the currency is trending sideways when you look at its history , and check where you are now compare to the past . If you above - the currency pair is trending up . if moreor less the same as before then its trending sideways.
personally me , i use the fx tech analysis for telling me the market trend direction and if its moving sideways
thanks for all your efforts.
There is Alligator Oscillator by Bill Williams that helps to understand how it works ;)
If you read Williams' books, he uses fractals with his Alligator to filter trades.
Hope this helps.
sincerely,
Martha
What other other strategy would you combine to make this strategy less vulnerable to the market? Something that would improve its rate of success. Thanks
Antonio
May be I don't completely understand your tasks, but MT4 platform allows you to test 1 hour TF as far back as 2006-2007 and even earlier.
I'm afraid I won't be able to sugget you anything from the list of resources you've provided, I simply not familiar with them.
May be other users can help. I suggest you also post your request here: http://forums.forex-strategies-revealed.com/metatrader-f11.html
Regards,
Edward
Thanks a lot Edwards,
I am aware of MT4 platform, but I think it does not allow to test my strategies, for say on hourly timeframe for the period 2006-2007??
Anyways, do you feel there is any need to purchase and pay for charting softwares from companies like
http://www.fxtrek.com/About/products.asp
http://www.forextester.com/index.html
http://forexsb.com/
http://www.tradingsolutions.com
http://www.prorealtime.com/en/
What could be the difference b/w these and MT4 charting, and any feature standing out, which I will miss with MT4?
Thanks a lot
MT4 platform from IBFX, for example.
I use their demo to test various indicators.
Regards,
Edward
Edwards, can you please recommend which charting softwares I can use for backtesting the results, that is I can see the hourly charts for say 2007-2008 period and so on.
I would be highly obliged.
Thank You
Post new comment