


Complex trading system #5 (Fibonacci trading)
Submitted by Edward Revy on June 30, 2007 - 13:27.
Traders were asking to post some strategies that will work on smaller time frames.
Here is one very nice trading system that can be worth your attention.
When a trader chooses to use small time frames (like 10 min, 15 min, 30 min even 1 hour) risks to be wrong are always higher than with larger time frames.
Therefore, it is very important to have a really good Forex trading system that can advise on entries with high chances to win and what's more important it should be able to tell exactly where to exit without need to constantly monitor the price.
Read entire post >>>


There are two things we can check:
I think we can label a trade as potentially bad or questionable if the following condition is true:
For Long orders:
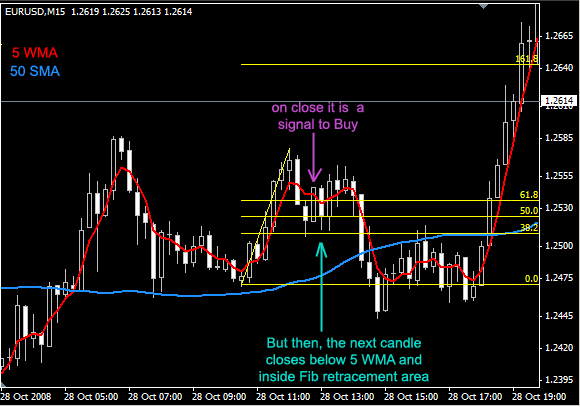
1. Upon entry on the close above 5WMA and according to the main rules, keep an eye on price bars. A bar should not close back below 5 WMA while we are still in Fib retracement area, e.g. while price trades anywhere in between 38.2 and 61.8 retracement levels.
2. If condition #1 is true, we've got a suspect. You may decide to exit or tighten your stop.
3. Every other case of price bar closing below 5WMA when we have moved outside and at least one full bar away from Fib retracement level is fine.
Opposite for short.
Example:
Now I'm adding one more indicator: BB 20, 1.
The idea is to hold onto a wobbly trade until price remains above Bollinger Bands mid line (for uptrend).
Might not be the best case with a current trade, but still:
Here is another one:
And finally some common sense:
Would I look for opportunities to trade after seeing something scary as this?
Certainly not. And if I happen to be caught somewhere in, my bias would be to hold upwards until I'm above 50 SMA. And then there is a first close below the lower Bollinger band - this is where you no longer want to be Long.
Best regards,
Edward
I've tested this strategy for about 2 months in a demo account. It works about half the time and currently I'm at break-even. The main problem as I see it, is that the S/L must be set too wide in order to allow the trade to develop. Then in the case it goes bad, the stop loss is too far back compared to T/P level, so risk/reward ratio is not good enough. If we could figure out a way to detect a bad trade sooner, then I guess it could bring slow but steady profits.
Ok, here we go.
1. In range bound market entry point remains the same.
Exits is going to be adjusted to 76.8 basically when after moving away from fib retracement levels for a moment, price returns inside Fib retracement levels again. When it does so, it often gets stuck in between levels (in between 38.2 and 61.8). A few back and forth moves should trigger an alert and so one can move stop loss to 76.8 if confident that a trend isn't over yet.
For confirmation, one can hire Simple moving average 50, where price remaining below it would be making us downtrend bias, above - uptrend bias.
2. Around 2-3, sometimes 4 good trades a day on one pair is enough.
3. The strategy works with any pair. The key in choosing pairs and time frames is to never force a trade. A traders should look for an easy going and falling under the rules setup. If a setup is shaky or doesn't look good, don't attempt trading, look for better opportunities.
3.a. In addition to filtering trades, when 50SMA on the chart goes flat, that's a warning of range bound market settling or progressing. Not much opportunities for trading.
4. The reason I didn't recommend daily charts is because Stop loss orders would be too distant. Also reaching Fibonacci based profit targets on daily charts is a bit of a challenge, many of daily fibonacci setups doesn't make it to the finish line.
Regards,
Edward
Hi guys,
I see all your questions. Thank you.
Today is a bit late.
I'll answer all of them this weekend.
Regards,
Edward
Edward,
Can this strategy be used for daily candles, as well?
Thanks for your superb job.
Nelson.
Hi Edward, I am now trading this system and understanding it quite well - making over 100 pips yesterday which I hope is a good start. (Somewhat better than what I had been achieving to date. losing over 400 pips in 5 days!!!!). Many thanks.
The final bit of my strategy I think is to understand which currencies to use at any point in time and how to choose when to use which. Have you experience of using this strategy on various currencies and does it appear to be valid for any pair? If so, then on what basis would you decide which currency to trade at any particular time? Do you simply pick the one with good levels of volatility and volume?
Thanks again for saving my trading life!!
Tim
Hi Jason,
During sideways markets chances to reach profit target at 1.618 decrease dramatically.
Thus:
1. you may look to reset your target to 1.270 level.
2. once you realized that price is sliding sideways, wait till you make some +pips AND as price approaches resent top/bottom (which are support/resistance now and are threatening to stop the price and keep it in a channel), move your stop loss order to break even.
ADX helps detecting sideways markets, but I find it less helpful for time frames lower than daily.
For small timeframes the quickest and most efficient way of detecting sideways price patterns is price pattern observation. You've probably heard it many times before: price that fails to advance over the previous top/bottom is setting the first alert about possible sideways slide.
I found a comment where I addressed the subject of identifying sideways markets by using support/resistance levels.
http://forex-strategies-revealed.com/advanced/trendlines-breakout/cpage-...
Now, let's try adding some new rules, shall we?
The base remains the same - tops/bottoms/supports/resistances.
The rules we add should just help to aid our observation.
What we want to know is where to start looking at possible support/resistance failure to avoid chaos.
I propose next simple method:
Add 20SMA.
When price touches 20SMA, this is our trigger to start looking... We look back and visually identify the most recent top and bottom.
Now, watch the price: if it advances through previous top/bottom - the trend is continuing. We won't need to question the trend until price touches 20SMA again.
But, if previous top/bottom level holds strong and price fails to surpass it, you've got a first warning that moving forces behind the trend aren't strong, and so the market will most likely move and test the other side of the opposition. (Important: an unconfirmed trend is treated as a sideways move right away.) Failing at the opposite end confirms sideways pattern. Set channel boundaries and wait for a breakout.
That's it. So far just a description, I'll make a screenshot for it later.
Also a slope of 20 SMA provides some additional clues about the trend direction.
Again, once more: everything which is not trending is moving sideways. E.g. if a trend is not confirmed, it is NOT a trend.
I may disappoint you, however, regarding your request about the screenshot of my recent trading with this method. I don't use it in its pure form these days, I'm trading my crazy mix of strategies. Making a requested screenshot according to the rules just to pretend that I traded it would be unfair.
Regards,
Edward
Edward,
Two completely separate points:
1. Can you just add a little detail about entry/exit points in a range bound market. I am struggling to equate the '76.8' reference to the charts and whether you set the stops differently BECAUSE the market is range bound?
2. I am a new trader and am struggling in good part I think because I seem to think I need to be placing a trade every 5 minutes! I walk top my computer in a mind-set that I am going to find a trade when I sit down, and therefore manipulate the charts until such point as I convince myself that there is a trade to do!! I think you system may help - but to help, can you set any expectation/norm as to how many trades you would do, say for the EUR/USD, per day, using this system?
It would just help to understand if that number is 1, 10 or 100!
Many thanks.
Hi Edward,
Is the profit target going to be the same 1.618 Fibonacci Extension level in a sideways moving market? What indicator would you use to confirm that the market is ranging? Is it possible to get a screenshot of a recent trade you have made using this strategy in a ranging market?.... Looking forward to your response.
Thanks,
Jason
Jamaica
Hi,
It works during sideways moving markets too. Just keep an eye on the ultimate 76.8 Fibonacci retracement level when ranging market has been established (you may want to move your stop behind that level if price starts to move sideways).
If price makes it behind 76.8 level it will be a strong signal of a trend is going to reverse, and thus we want to be out.
Regards,
Edward
Seems in a sideways market cannot work, isn't it ? waiting for your reply. Thanks
Hello Edward,
I have tried many systems over the many months that I have been trading and I must say that this one has been the most profitable by far.
I find that the 20 EMA and 200 EMA that you suggested are very good filters.
As with all other profitable systems it requires alot of patience and discipline, but once one possesses these qualities there is no limit to the amount of profits you can reap.
Excellent lesson....
Thanks
Jason
Jamaica
You draw it right.
It's me who changed the numbers (in Photoshop).
I tried to fit two parameters in one screenshot.
I showed first that the market retraced N% first.
Then after we enter, the Fibs are re-drawn with the same Fib retracement tool to project the target at 1.618.
Regards,
Edward
Please explain, how come the 1.618 is lower than the other lines ?
When i draw my fibo, it appears above them....
Thanks in advance
Qais,
In that case we simply exit the trade.
I've made a screen shot for everyone to follow.
Happy trading,
Edward.
Post new comment