


#19 (Ultra-Short Term Forex Trading Strategy)
Submitted by User on March 8, 2013 - 14:30.
The forex strategy that we will discuss here is an ultra-short term forex strategy useful for trading currency pairs on the 15 minute time frame. It can be used on any asset, but works best with currency pairs that are known to trend greatly.
Details
This 15-minute forex trading strategy will use the following indicators:
- The 2-day exponential moving average (seen on the chart as the yellow line).
- The 5-day exponential moving average (seen on the chart as the red line).
- The 10-day exponential moving average (seen on the chart as the blue line).
- Forexoma_MACD, which is a modified version of the conventional MACD
indicator. Download: Forexoma-MACD.ex4
Unlike the conventional version of the MACD, the Forexoma version is specifically colour-coded to ensure that as soon as the bars of the MACD start to show a change in direction, there is a colour change. The essence of this modification is to catch the trend changes much earlier, as it has been found that waiting for the conventional MACD indicator to change from positive to negative or from negative to positive causes a lag which delays the signal.
Long Entry Rules
The entry rules for the long trade are based on the cross of the shorter term EMA over the progressively longer term EMAs.
a) Buy when the 2EMA crosses above the 5EMA, and both 2EMA and 5EMA cross the 10 EMA in an upward direction.
b) The Forexoma MACD line must change colour from red colour to blue colour at the same time that the EMA crosses occur.
The positioning of the stop loss and profit targets is done at the discretion of the trader. However, it is important to mention that this is a trade with a very short term outlook, so it is in order if the profit targets do not exceed 30 pips per trade.
Short Entry Rules
The entry rules for the short trade are based on the downward cross of the shorter term EMA below the progressively longer term EMAs.
a) The trader should sell the currency pair when the 2EMA crosses beloow the 5EMA, and both 2EMA and 5EMA cross below the 10 EMA.
b) At the same time that the EMA crosses occur, the Forexoma MACD line must change colour from blue colour to red colour to reflect the change indirection of the moving averages.
Traders are at liberty to set the stop loss and profit targets at their own discretion. The short term outlook of this trade means that only a few pips should be aimed for at any given point in time, so it is in order to set stops and profit targets at a maximum of 30 pips per trade.
The charts below are illustrations of long and short orders using the strategy we have just outlined.
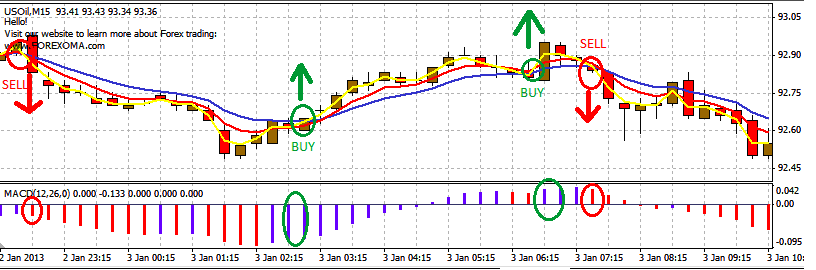
The chart above shows the three exponential moving averages as well as the Forexoma MACD indicator. We can see two sell and two buy signals, which provide clear identification of how the respective trades should be taken. The 2nd buy signal was not very successful because the asset was in consolidation mode.
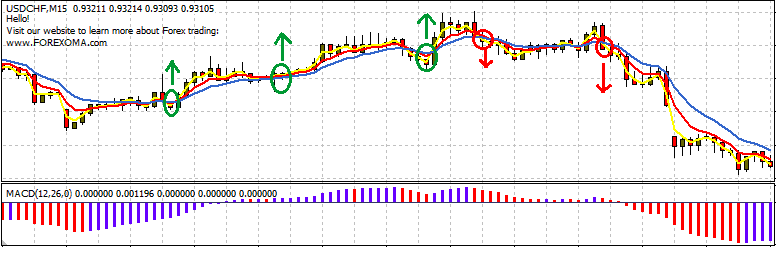
This is another chart which shows what happens when an asset is range-bound; the signals are not reliable as there is no room for the asset to get the volatility needed to generate profits. The only valid trade is the second sell signal which occurred when the asset started to trend lower.
The trade setups are valid as long as the asset is trending. The trader can tell if an asset is trending by checking if the currency pair is making higher lows and higher highs (uptrend) or lower highs and lower lows (downtrend).
This short-term trading strategy was provided to us by Adam Green, owner of BinaryOptions.com. Visit his site to learn more about short-term trades and binary options strategies.
Edward Revy,
http://forex-strategies-revealed.com/
Copyright © Forex Strategies Revealed


good good good thanks for giving
Hi,
Looks good and will check if it works. By the way is the second chart supposed to be the same as the first?
FxKTide
Post new comment