


Forex trading strategy #4 (RSI High-Low)
Submitted by Edward Revy on February 28, 2007 - 14:14.
Although no trading system can solely rely on RSI indicator, using it in combination with other tools and proper technical analysis can bring a new edge to your Forex trading.
Setup:
Currency pair: Any.
Time frame: Any.
Indicator: RSI (14) with levels at 70 and 30.
Read entire post >>>


Hi everyone!
I tried the strategy posted at top of this forum. It sounds nice, and I added 2 indicators: An Exponential Moving Average 200, close and fractals.
EMA 200 gives you the trend to follow (prices up EMA = buy, prices down EMA = sell) and fractals helps to find extreme points where you can get in or get out of the market.
Test it, and please, comment your results!
Have a nice trading!!
CARLOS ALBERTO CASTILLO SANCHEZ
Bogotá, Colombia
Thank you,
with 5 min trading and according to the first User comment it would look next way:
When the RSI climbs above 70 and then crosses 70 down - Sell. When the RSI dips below 30 and then later crosses 30 on the way up - Buy.
Profit target is 10 pips.
Stop loss on 5 min can be set to 10 pips as well; or below the most recent swing low / above swing high if they happen to be reasonably close.
Regards,
Edward.
Hi Edward,
I have a question about the first comment.
Someone suggested GBP/USD 5 minute chart and RSI(7).
Does he/she suggests Take Profit 10 pips after entering the position?
When do i exactly enter the position? Is it when the RSI climbs abuve 70 and crosses 70 going down?
Where do i set the stop loss in this case? If t/p is 10 pips?
P.S. Excellent Website!!!!!!!!!
Shadows are the tails above and below the candlestick body.
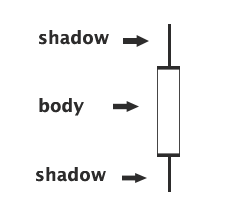
Here is an illustration:
Regards,
Edward
"WHAT WOULD BE THE MEANING IF SHADOWS FORM ABOVE OR BELOW A CANDLE STICK?"
What are those shaddows???
RSI (14, 70, 30) stands for RSI 14 and two levels/horizontal lines at 70 and 30.
14 is a standard period for this indicator.
Regards,
Edward
Hi Edward,
What does the numerals after the RSI mean? That is RSI 14,3,3; RSI 7,3,3.
Shadows won't affect this strategy.
Regards,
Edward.
WHAT WOULD BE THE MEANING IF SHADOWS FORM ABOVE OR BELOW A CANDLE STICK?
Hi Edward,
Thank you so much for your quick response and helpful information! Out of all the thousands of sites out there this is by far the best, keep up the good work! :)
Hi,
You may try combining RSI with Stochastic (5, 3, 3). Entry should be initiated on Stochastic lines cross and only if RSI has returned from overbought/oversold area. Not all Stochastic crosses are valid for entry though. Use only those that occur below 30 and above 70.
Regards,
Edward.
Hi Edward,
I'm new to the site and fairly new to the forex. I've recently become a single mother of 4 who is trying to learn as quickly as I can, but I've hit a few roadblocks. I've been using the RSI(7) on the 5 minute chart and got phenomenal results last week. This week has been a little different. Can you tell me of any other indicator that works well with this one that can help weed out the fake signals? Any info would definitely be appreciated.
I would use wide stop: around 50 pips and keep watching RSI, which if happen to move in oversold/bought zone short after the entry, would suggest immediate exit.
In such cases we don't wait for the stop to be hit, we exit immediately on the close of a signaling candle.
(Actually here we never want to be stopped out with 50 pips loss; 50 pips is rather a catastrophic stop during aggressive/unpredictable market conditions).
Regards,
Edward.
Hi Edward,
How many pips do you think the stop loss should be?
Great comment and nice results!
Thank you.
Happy trading!
Edward.
Post new comment