
Advanced system #13 (The Floor Trader System)
Submitted by Edward Revy on January 25, 2009 - 12:29.
Yesterday I've got another great feedback from one of our readers - Rahul.
He writes:
Hello Edward,
I think you are a very noble person because you are doing great work here helping newbies and also dispelling the popular myths about trading to show ppl the reality. I think you have a very good heart. Thank you for helping all our brothers and sisters out there in the forex world.
I have found a strategy which is the real thing .... it has been used by a contemporary of Denis Richard and used by many professional traders who have made millions from it.
I demoed it and made a 100% profit every day for 5 days in a row only taking level 1 signals.
I used to make 2 hundred pips a day to double my account and it worked everyday.
Then I went to live trading and my account is up 40% in a month i could have easily made 100% but when i went live i risked only 0.5% per trade this is just to be on the cautious side this proves the strategy works.
It is a 100% free completely free and very well documented and tested it is developed by professional Chicago pit traders.
I challenge anyone who follows these rules not to be profitable at the end of the month. i am dead sure if u restrict yourself to level 1 you have to be profitable its not possible ur not profitable.
If ur confident and up ur risk per trade to 5% you can easily make 3 times your equity in a month but this is not advisable .... whats the hurry.
Well anyway the strategy can be found here .... http://www.trading-naked.com/FloorTraderMethod.htm
I hope u publish it
thanks for your kindness
Rahul
---------------------------------------------------------------------------------------------------
Thank you, Rahul!
Sure, why not highlight it here.
So, here we are, starting a new topic discussion and simply re-publishing the system, with all credits to the source: http://www.trading-naked.com/FloorTraderMethod.htm
---------------------------------------------------------------------------------------------------
The Floor Trader System
This is a retracement-continuation trading method. It combines trend identification properties of moving averages with the pattern recognition entry techniques.
The primary pattern to look for is the Price Reversal Bar - in conjunction with a retracement within the current Trend Cycle.
RETRACEMENTS
A retracement within a downtrend is a minor rally.
A retracement within an uptrend is a minor decline.

In diagram "A", areas 1 and 2 are rally retracements in the overall downtrend - minor rallies that ended with descents to new lows.
In diagram "A" areas 3 and 4 are decline retracements in the overall uptrend - minor dips that ended with rallies to new highs.
THE PRICE BAR REVERSAL - Buy signal after a decline retracement.

During an uptrend, a decline retracement forms - price bars with lower highs. If the uptrend is confirmed by the Moving Average indicator (explained later), then the trader looks to buy the upside breakout of this temporary decline, by watching the high of the price bar prior to the current price bar. When prices within the current price bar rally above the high of the prior price bar by 1 tick or more, the trader should buy.
Diagram "B" shows two examples. Price bar "X" is the first bar in the decline retracements which rallies above the high of the bar which precedes it.
THE PRICE BAR REVERSAL - Sell signal after a rally retracement.

In a downtrend, a rally retracement forms - price bars with higher lows. If the downtrend is confirmed by the Moving Average indicators, then the trader looks to sell the downside breakout of this temporary rally by watching the low of the price bar prior to the current price bar. When prices within the current bar fall below the low of the prior price bar by 1 tick or more, the trader should sell short. (In the above example, price bar "X" triggers the short sale.)
(In practice, a trailing sell stop adjusted to the low of each successive ascending price bar would be placed, if the trader used one of the new on-line entry systems enabling frequent cancel/replaces. If phoning in the trades, the trader would have to resort to trading at the market or at a limit price "giving up" a tick or two. This procedure would be reversed for buy signals.)

The best retracements will contain 2-5 bars before the reversal occurs. In volatile price moves, 1 bar retracements are sometimes valid. Generally, rally retracements in a downtrend will be steeper and will contain fewer price bars than decline retracements in an uptrend. A retracement lasting longer than 6 bars may be suspect.
The shape of a retracement is also important. The optimum formation consists of price bars which become smaller in range as the retracement progresses. (Example "A" above, for sells.)
Also valid are price bars of equal size "B". Patterns with widening price bars are less reliable and may be skipped "C". This is an area where individual judgment is needed. For buying into an uptrend, "D" and "E" are ideal formations, "F" is questionable.
What makes certain patterns ideal is the "V" shape they form when the Price Bar Reversal occurs. The best trades usually spring from symmetrical V patterns.
THE MOVING AVERAGE INDICATOR
Trend Cycles - looking at the price bar formation in conjunction with the 9 and 18 period moving averages will identify the presence of either an Uptrend Cycle or Downtrend Cycle. Once the trend cycle is known, the trader next looks for retracements.
The Uptrend Cycle is identified by:
1. Prices trading above both MA's (moving averages).
2. The 9 MA line is above the 18 MA line.
3. The slope of one or both of the MA's is up.
(Exception: occasionally the 9 MA will be under the 18, but curving upward, about to cross over. This formation is allowed.)
Number 1 is the primary qualifier; prices must first trade above both MA lines - subject to these 2 conditions:
1. Trade above the lines should last for at least 3 bars. OR
2. Trade should take place at a "significant" distance above the lines (before retracing to touch the MA lines).
The Downtrend cycle is the reverse:
1. Prices trading below both MA's (moving averages).
2. The 9 MA line is below the 18 MA line.
3. The slope of one or both of the MA's is down.
(Exception: occasionally the 9 MA will be above the 18, but curving down, about to cross over. This formation is allowed.)
Number 1 is the primary qualifier; prices must first trade below both MA lines - subject to these 2 conditions:
1. Trade below the lines should last for at least 3 bars. OR
2. Trade should take place at a "significant" distance below the lines (before retracing to touch the MA lines).
TRADE ENTRY SIGNALS
There are three types of entry signals: Level 1, Level 2 and Level 3 (abbreviated as L1, L2 and L3.)
Buy signals, LEVEL 1:
After establishing the Uptrend Cycle a decline retracement occurs, then:
* Prices trade lower to enter the zone between the 9 and 18 period moving averages.
* One or more price bars touch the 18 MA (or penetrate slightly below the MA line)
Once the 18 MA has been touched, watch prices for a rally that breaks above the high of the preceding price bar by 1 tick or more - the Price Bar Reversal, which sets off the L1 buy.
The LEVEL 2 Buy signal:
* The MA qualifiers are the same as with the L1 buy, and prices decline in a retrace from above the MA lines to enter the zone between lines. In the L2, however, a Price Bar Reversal buy signal occurs before the 18 MA is hit. The market begins to rally without touching the 18 MA and triggering the L1 signal.
Level 2 buys are subject to this condition: Do not take an L2 buy right after a Crossback Top (explained later). Wait instead for a Level 1.
The LEVEL 3 Buy Signal:
In this case the Price Bar Reversal takes place above both MA lines (or just touching the 9 MA line) after a shallow retracement. Two qualifiers:
1. The Corssback Top condition as with the L2 signal, and
2. Only take L3 buys if they are the first buy signal in a new Uptrend Cycle.
Qualified L3 buys are not common. The best ones form when the market is trading at new highs in a "runaway" rally, or in mid-range after a strong bottoming formation.
Sell signals, LEVEL 1:
After establishing the Downtrend cycle a rally retracement occurs, then:
* Prices trade higher to enter the zone between the 9 and 18 period moving averages.
* One or more price bars touch the 18 MA (or penetrate slightly above the MA line)
Once the 18 MA has been touched, watch prices for a decline that breaks below the low of the preceding price bar by 1 tick or more - the Price Bar Reversal, which sets off the L1 sell.
The LEVEL 2 Sell Signal:
* The MA qualifiers are the same as with the L1 sell, and prices rally in a retrace from below the MA lines to enter the zone between the lines. In the L2, however, a Price Bar Reversal sell signal occurs before the 18 MA is hit. the market begins to fall without touching the 18 MA line and triggering the L1 signal.
Level 2 sells are subject to this condition: Do not take an L2 sell right after a Crossback Bottom (explained later). Wait instead for a Level 1.
The LEVEL 3 Sell Signal:
In this case the Price Bar Reversal takes place below both MA lines (or just touching the 9 MA line) after a shallow retracement. Two qualifiers:
1. The Crossback Bottom condition, as with the L2 signal, and
2. Only take L3 sells if they are the first sell signals in a new Downtrend Cycle.
Qualified L3 sells are the best when the market is trading at new lows in a "panic" decline, or in midrange after a strong topping formation.
CONTINUATION ENTRY SIGNALS
Continuation buys are additional buy signals given after the first signal in the same Uptrend Cycle. For sells, they are the reverse; additional sell signal, withing the same downtrend, which follow the first sell signal.
The rules are somewhat different for buys vs. sells:
Continuation Buys - The first buy signal in a new uptrend must be monitored, whether taken or not. If this trade stalls, or returns to breakeven, take no additional buy signals in the current uptrend cycle. Wait for a change to a downtrend, and "recycle" to a new uptrend.
If the first buy signal is a winner and a secondary buy signal sets up, take it if the price pattern which creates it is well above the price pattern of the earlier buy signal - no "overlap". (There should be a strong upward slope on the chart.)
Continuation Sells - Additional sells in the same downtrend cycle can be taken with more freedom than in the case of buys.
Continuation sell patterns can overlap as long as the MA line qualifiers hold to the downtrend cycle. However, once three Level 1 sells have taken place, take no more sells of any kind in the current downtrend cycle. Wait for an uptrend cycle to intervene, even if it is an incomplete one (discretionary).
In general, the best trades of any kind, are the first trades of a new Trend Cycle. In other words, the highest % success will be with a trigger on first pullback after the MA crossover.
PROTECTIVE STOPS
Initial Stops: Upon entry of a trade, the initial stop-loss is usually the Pattern Stop, the basic stop in this method.
When a trade shows average follow-through into a profit position, the Pattern stop is placed. For sell stops on a long position, it is 1 tick below the low price of the setup pattern. For buy stops on a short, it is 1 tick above the high price of the setup pattern.
If a trade "stalls" after entry, use Pattern Extended stop, which is the width of the setup pattern multiplied by 2, in most cases. Sometimes it is measured by the pattern before the entry; sometimes the pattern is measured after trade entry, and includes the distance reached before the stall and reverse.
Going to Breakeven: Once the trade is a winner and travels a distance 2X the setup pattern, one can move the stop to breakeven.
Another condition, subject to individual judgment, is to look to exit as breakeven on a stalling trade once 3 or more price bars have formed after entry, including the entry bar. (However, some trades end up winners after trading sideways for a while.)
PROFIT TARGETS
Conservative strategies: Once a trade is profitable, one exit method is to look for "V" reversals in the other direction to signal a possible exit. These can be monitored on a smaller time frame than the trade entry timeframe to give greater accuracy - especially if volatility increases after entry. For example, a winning entry on a 5 minute chart can be monitored on a 3 minute chart for exit levels.
Watching market action as prior price wave tops (if long) and prior price wave lows (if short) is another strategy. If a "V" forms, and prices reverse, and exit may be needed (at the market).
Possible extended profit moves: If a long position shows an increasing profits, a strategy to take advantage of a possible large move is a sequential process -
1. Leave the initial breakeven stop in place.
2. Hold on though the first V reversal declines, as long as B/E stop is not reached.
3. Watch for the formation of ascending price waves; higher highs with higher lows. When the first one forms, move the B/E stop up to a position 1 tick under the low of this upwave; if another clearly-defined upwave forms later, move the sell stop 1 tick under this one as well.
4. Watch the market action at the current days' high. Drop down to a smaller timeframe - the 2 minute chart, if day trading indexes.
5. If the market makes a new high, then "crosses back" under this price, watch the low reached on this downwave. Cancel/replace the sell stop to a position 1 tick below this low, once formed. This strategy, though complex, will reduce of the desire to take profits "before they get away".
6. If the days' high is surpassed, check for important price tops on longer term charts - 15 minute, 30 minute, even daily, for highs reached on previous days. Apply the same crossback sell rules to these levels as well.
If trading with multiple contracts, there is more flexibility. Part of the position can be exited conservatively, while the remainder can be held for a longer move.
The "extended" strategy is nearly the same for winning short sales in a declining market. Make the appropriate substitutions in the above directions.
Once exception: rally retracements in declines tend to carry further than decline retracements during rallies. Buy stops should be given more "room" to avoid exiting too soon on a sharp, but temporary short covering rally.
----------------------------------------------------------------------------------------------------------
Apparently, the strategy promises, but doesn't describe the "Crossback Top" and "Crossback Bottom" cases.
----------------------------------------------------------------------------------------------------------
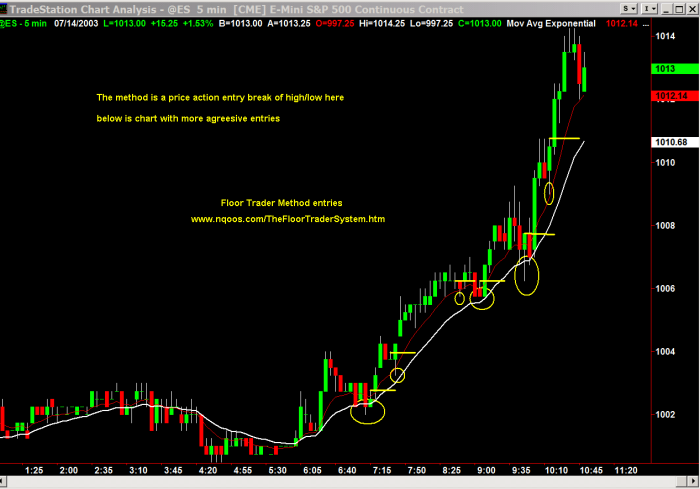
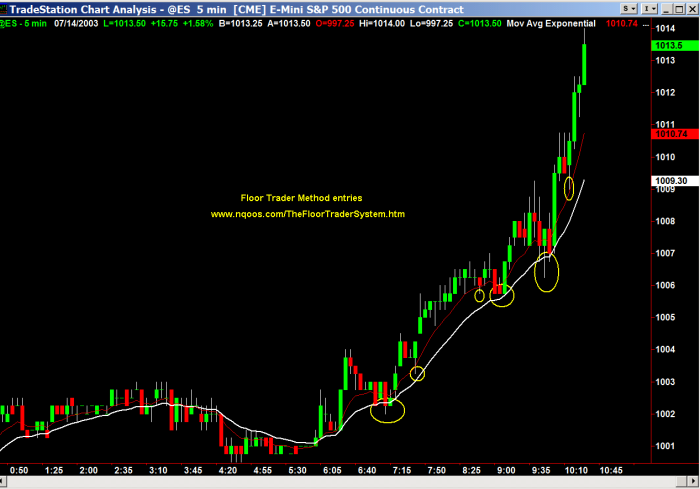
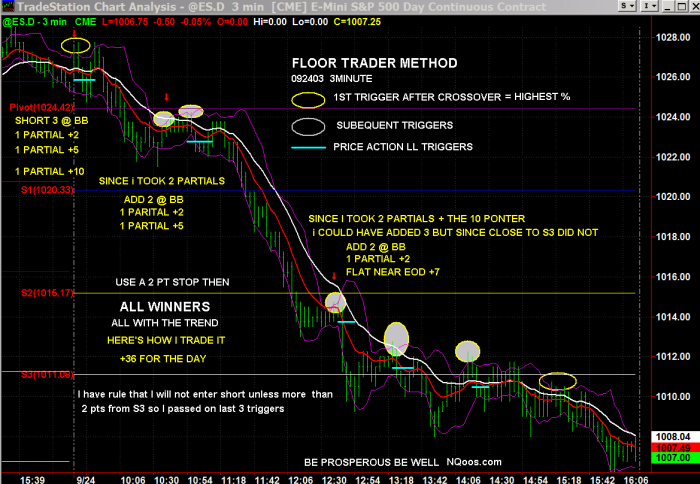
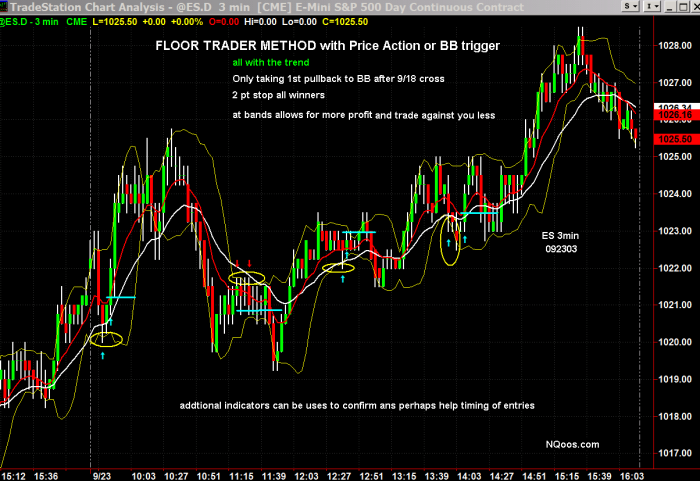
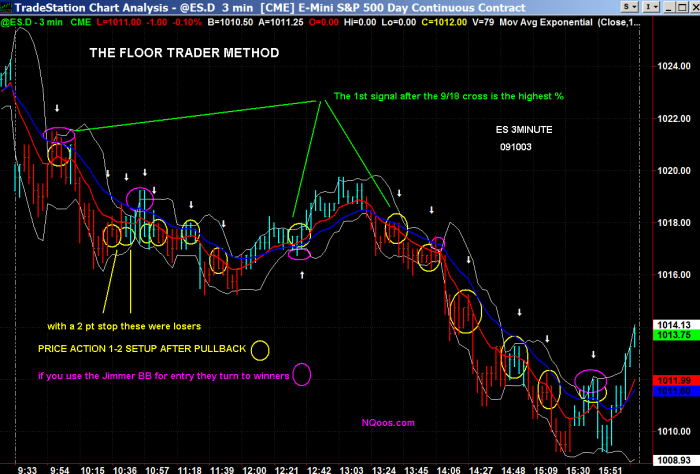
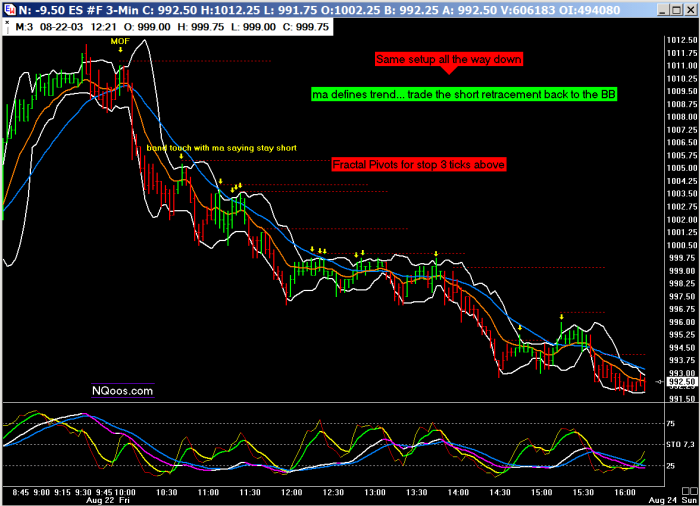
Screenshots with trading examples are taken from the source: http://www.trading-naked.com/FloorTraderMethod.htm
On the last two screenshots you can notice that Bollinger bands has been added to guide the entries. The settings for Bollinger bands are believed to be (8, 1.8)
Happy trading!
Edward Revy,
http://forex-strategies-revealed.com/
Copyright © Forex Strategies Revealed




thank u very much. which ma is it exeptional simple or...?
This method is far more profitable if you strictly stick to the L1 criteria, the symmetrical V shape continuation retracements declining in bar/candle size and instead of waiting for only 1 EMA to point in the trend direction, wait for both. As for indicators, RSI <50 should work well after first retracement and pivot points should objectively dictate market sentiment- I think the BBs work nicely in Rahul's screenshot also
9 EMA and 18 EMA cross, wait for price to pullback to 18 EMA, place an order at the previous swing + 2 pips. All the extra info throws a lot of people off.
You're nuts to trade this method on a daily chart.
Above User- "I understood the indicators and stuff but this still went over my head. Could someone please explain it simply and with all the comments that have been added in? thank you."
I believe this system is optimized through 3 easy steps
1. Take a broad birds-eye perspective of the overall direction of the market on higher TFs and scale back to your preferred trading TF to see if it is in alignment with the higher TF (I like to use in conjunction with a 150 SMA)
2. Only take L1 entry signals pulling back slightly past 18 or touching ( after the first MA crossover and ONLY in the direction of the overall trend on higher TFs)- L1s are deeper pullbacks and are basically getting in at a better discounted market price than L2/L3 entries and are therefore higher odds trades.
3. Probability is also increased if the pattern of the deep pullback/retracement is in a clear U or V shape encompassing more than 3 candles. I also like to add a double RSI 2 over/under 12 crossover and +/- 50 level as it is quite precise
Following these 3 steps cuts out a lot of bad trades in my opinion
Best
William
I understood the indicators and stuff but this still went over my head. Could someone please explain it simply and with all the comments that have been added in? thank you.
Thank you very much for your comments :)
To the last poster, this is a good system that needs to be applied with a certain level of discretion.
I'd advice that you look back at your losing trades and evaluate what you could have done differently and focus on fine tuning the method as you may have realised on this thread a no. of people have had success with this system.
I can assure you that they would have made their own little tweaks to make the method their own to give them the confidence to trade it profitably and practised and practised until they could trade it emotionless.
Trading requires a huge amount of work and it is often perceived as a "get rich quick scheme" But of all the full time traders I know, they are all humble and very hard working people who have put in the hours and hours of screen time and are now fully reaping the benefits.
Best of luck with the journey!
Hi, I also have spent a long time looking at this strategy and its looks great in back testing but I too lose money when trading live - I mainly use the 5 min charts. Is someone able to confirm if they are successfully trading this live on the 3/5mins charts?? Would really appreciate any feedback!!
i love this setup and holisticly spent a month in back testing and found the real money it offers. However now in live when i started trading using this setup profit/loss is mixed. Is it because of wrong use or because of market in specific for july ?
this is the best strategy ...practice makes you prefect..chose a broker with low spreads and scalp with this strategy you will make good profit.
wow what a great strategy ! works well on D1 charts
thx all
Hello,
I am looking for an EA that uses the High + 2 Pips (Short) of the previous Bar as a Stop, with the rule that inside Candles are "left out" of counting until they break out. Has the advantage that it keeps you in the trade until it looses momentum. 5 Min. trading time frame. Alternative could be that the High of only every second bar becomes the Stop-Place, or that the bar has to close at least in the lower Half to become a Stop-Place. If not then the next bar (High) becomes without exception a Stop-Place. Not more than 1 candle can be "left out", next is Stop. And so on.
Any Ideas?
regards, Gerd
If anybody is interested in trading this strategy via a fully automated MT4 trading system then email me at [email protected]. I'll happily provide a version of my software configured to trade this strategy.
The software can be configured to work with lots of different strategies and includes the ability to manage stop and take profit targets as separate strategies. Very powerful.
Chris.
what is the meaning of setup pattern with help of which we put stop orders?
Post new comment