#6 Tom DeMark Trend lines
Submitted by Edward Revy on June 25, 2009 - 15:48.
This is a well know trend line breakout strategy by Tom DeMark.
The only difficulties traders had earlier were all about constantly drawing trend lines and calculating profit targets.
With a help of custom MT4 indicator this problem was solved.
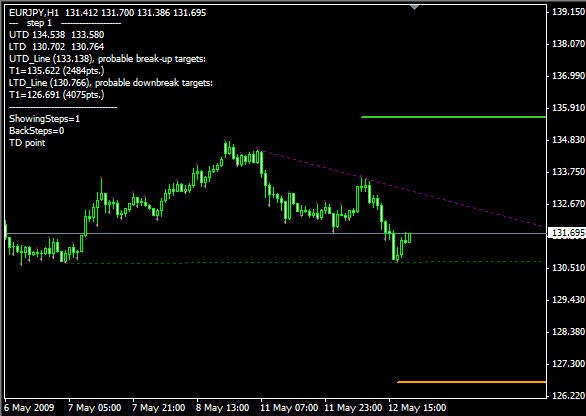
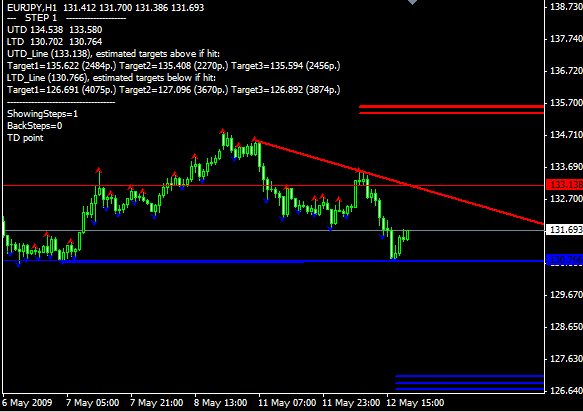
Two variations of the same indicator:


As you can see, the indicator not only draws automatic trend lines, it also shows profit targets or exit levels.
Indicators:
Ind_TD_DeMark_3_1_LA_Mod_03B_AIME.mq4
Strategy rules:
TD Line Qualifiers and potential filters.pdf
Edward Revy,
http://forex-strategies-revealed.com/
Copyright © Forex Strategies Revealed


Dear Edward,i just came across TD trendline indicator just a few days ago and i think is really great.Please i will like to know how to calculate the take profit manually.By this i mean the take profit that is being displayed on the chat when those fractals or the TD Lines joins.Please reply.I will be waiting for your reply.Mike
I have just one quick question and confusion regarding how td supply lines (let's just use supply line as example, once htis question is answered, the answer to td demand line is naturally resolved too) are drawn in the case when the more recent td point is ABOVE instead of below the preceding td point, hence creating an increasing instead of declining td suppply line. Tom demark, in both his books (new market timing techniques, and day trading options) clearly stated that this td supply line is only eligible if it is declining but he did not specify what to do with the 2 td points in this event. say we already have a declining td supply line level 1 (let's call them A and B, with B the more recent td point), then now we discovered a new td level 1 point C, however, C is higher than than B, now what do we do? do we discard the C and still keep the original td line (connected by A and B) intact, using it to determine whether future breakouts are qualified? or do we simply NOT have any active level 1 td line until we find a td level 1 point D such as line CD is downward sloping? and if CD is not, test if BD is declining and if BD is not, if AD is.
Thank you very much in advance for any guidance anyone can provide. I would really appreciate it!
I am also using this strategy. But i would like to know the best time frame to apply on this strategy and if the use of stochastic with this indicator is advisable. Pls i need your contribution. This is my email. [email protected]
At first, I thought this indicator would be great. So, I combined the TrendMeLeaveMe EA with this indicator. I had it running on 10 pairs. Wow, it was a heartbreak to see my balance and equity diminished. I guess I'll return to my good old fashion manual trading that generates real profit on a daily basis.
Hi Everyone,
Re the #3 Rule Qualifier. I understand the upside break rule, but for breaks to the downside (supply side)should the selling pressure calculation be the difference between the high & close added to the close? This is not clear in the rules cheat sheet, unless I've missed the point:-)
Thanks,
Mike
Hi All,
Very interesting and helpful site you have here Edward; I am most impressed by your patience and willingness to answer even the most trivial-seeming question!
My brain being a bit over the hill now, I wondered if anyone has an indicator that can examine all the valid TD TL break criteris and alert that a trade is set up to go?
Regards,
Mike
i'm kinda new to demark could you tell me the significance of the lines . i always have this problem .... after entering the candles almost always turns , sometims when i;m making it suddenly turns. could demark help me on this. could tell me when to enter or exit and when to take profit.... much obliged
but how do i get the first variation, the second variation is too convulted
Hi Edward,
Thanks for the good work you are doing out there. May God reward you abundantly.
Please how can i get the the support and resistance indicator that eddy mustika uses in his chart up there? pls you can send it to me at [email protected]
thanks in advance
chris
Thank you my man,you are indeed a great man and am very sure you are making great profit from trading forex.Some TD Rules do not apply to forex market because Gaps are Rare in Fx Markets as opposed commodities/Stocks.Thanks once again.
zakky
Also, if it is a supply trendline is the breakout always going to be up to take the trade and vice verse with a demand line? Thanks
Thank you to the question above. Exactly what I want to know. Also could anyone put an example chart up from mt4 with either on the above indicators on it and explain what everything is. I get to a stage where I'm pretty sure I understand it but then something happens where I think otherwise. Thanks.
Marc
Hi Edward,
Thanks for all the useful information. I m very new to TD. What is the difference between the two indicators. Also, I trade on daily charts...should I use the "TD-3-1 Eng" or "TD-3_LA Mod_...".
Also, appreciate if you can explain what is LL_1, HL_1, HC_1 etc. Tks alot.
Thanks for the new stratgy, i am a big fan of trendline and heard allot about Tom. this is the best indicator I've seen so far.Definitivamente TOM DeMark is a genius of forex.
Thank you very much,
Best Regards
Emmanuel Kingsle
(From Nigeria)
Hi Stanislaw,
please upload your screenhot to imageshack.us and send me a link to your uploaded file.
Regarding the selling pressure with Tom DeMark lines, I think this thread can help: http://www.forexfactory.com/showthread.php?t=295218
Best regards,
Edward
Post new comment