Forex trading strategy #47 (DOUBLE RSI)
Submitted by User on October 29, 2011 - 12:05.
Submitted by Victor
[email protected]
http://crystal-markets.blogspot.com/
I was asked to filter this trading plan:
The system is almost 100% accurate with backtesting, but trading life
is kindoff different.
Time Frame: 1hour
CURRENCY PAIR: Eur/Usd Gbp/Usd any other
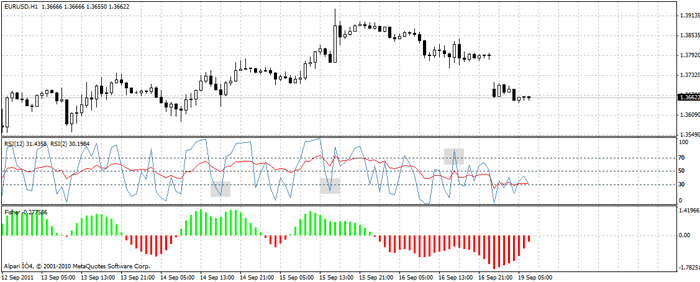
Indicators: RSI with Period (2) placed on RSI with Period (12)
To setup rsi simply place the rsi(12) on your chart normally then drag
the rsi again and place it on top of the rsi(12) and enter the setting
of two.This works in MT4 platforms.
RULES:
*Enter Buy When Rsi(2) cross Rsi(12) from below and heading upward
*Enter Sell when Rsi(2) cross Rsi(12) From above and heading downward.
Take Profit: 20 pips
Stop loss: 30pips or Swing High /Low
But sometimes you catch up with really big trends.(when i suspect a
big movement i use a trailing stop with a high tp)
This system has so many potentials because it can be used on 5mins,
10mins,15mins,1hour,4hours and daily chat with eur/usd and Gbp/usd.
Hence i need experts like you to look into it and make recomendations,
with refrence to how i can filter the fakeouts.
Sometimes the rsi cross would occur but before the candle formation
finishes the cross would dissapaer.
MY RECOMMENDATIONS:
Because you will see a lot of whipsaw and when the short RSI closes across the long RSI you would have missed a lot of good moves.
You need to add default fisher. If you are trading the 60min for example: When fisher is green (BUY) wait for 2 RSI to go below the 12 and the fisher still BUY in 1hr and 4hr then look for BUY entry. I trade one BUY per one set of 1hr green fisher. The chart below shows example of 2 BUYs and 1 SELL. Please leave a comment here if you have questions:
Details of pictures here: http://crystal-markets.blogspot.com/2011/09/double-rsi.html
Edward Revy,
http://forex-strategies-revealed.com/
Copyright © Forex Strategies Revealed


can please post da indicator 2 rsi an if you couls post 2 roc as well please a can´t find in the net eniwere
Victor:
Thank you for you excellent article on 2-period RSI. The correlations between 2-period RSI and short-term market behavior was originally discovered and quantified by Larry Connors and Cesar Alvarez of Tradingmarkets.com
I also wanted to make you aware that they've developed a new Trading Oscillator named ConnorsRSI along with a free a Strategy Guidebook with full disclosure to assist you and your blog audience in trading this oscillator. You can download the Guidebook “An Introduction to ConnorsRSI” here:
http://info.tradingmarkets.com/ConnorsRSI_ConnorsRSI.html?utm_source=lcl...
Also, you can get the daily ConnorsRSI readings on all US stocks on the TradingMarkets Screener which you can find here:
http://analytics.tradingmarkets.com/Screener?utm_source=lcl&utm_medium=l...
Just to let you know, they researched and quantified the 2-period oscillator and have found it to be one of the statistically best oscillators for traders. ConnorsRSI is the next generation oscillator with significantly higher edges at market extremes and its available for everyone to use at no cost.
In addition, if you want to learn about an even more new more powerful variation on RSI you can download the research for free here:
http://analytics.tradingmarkets.com/ConnorsRSI/
hi, i can't drag rsi on one another, please help me...
HI Guys,
I too use two RSIs, one set to 'high' and the other set to 'low' (both period of 4) to help me with both bearish divergence and with bullish divergence respectively. The normal way is to use just one RSI, set to whichever period you like, to look for both bullish and bearish divergence. This misses a lot of divergences and lost oportunities.
However, when price is going up and you are looking for signs of bearish divergence, if you look at the RSI set to high, you will see many more bearish divergences than with just a single RSI set to close.
Likewise, if you use the RSI set to low, more bullish divergences will show up.
To save space, I put use the Navigator window and put one on a chart, set to high, then drag n drop another RSI on top, set that one to low, and give them both different colours. Your eye will soon get used to looking at two RSIs.
If you also put a RSI set to 'close' in another window, you can see how many divergences it misses compared to the two high/low RSIs.
I hope this is of use to you.
Regards,
Mike
hi imade two new strategies basing on this thx a lot
Updated version of DOUBLE RSI here: http://crystal-markets.blogspot.com/2012/03/double-rsi-beta.html
Crystal Markets
http://crystal-markets.blogspot.com
I will see if I can do a VIDEO explanation as soon as i get all the software to do it.
Crystal Markets
http://crystal-markets.blogspot.com/
i am unable to drag and place one RSI on top of the other RSI. what do i need to do? i am using meta 4
try 3 rsi, which is 3,10,14 in the same indicator. once rsi 10 and 14 turned from the oversold, overbought teritory and wait for rsi 3 to touch high or low of rsi 10,14 reversal point to buy or sell
Fisher repaints. If you know what that means, great. If not good luck.
Fisher_Yur4ik.mq4
Enjoy!
Fisher is a Technical Indicator you can download from earnforex.com
Crystal Markets
http://crystal-markets.blogspot.com/
Yes, done. Thank you!
http://forex-strategies-revealed.com/simple/manual-trading
Hi!
Can someone paste this strategy, seems to be good, I was try to paste here, but unsuccess
Might also want to add a "silent zone" to the Fisher indicator of around 0.45 & -0.45(levels)to filter out the flat trends when all other signals are telling you to enter.
Post new comment