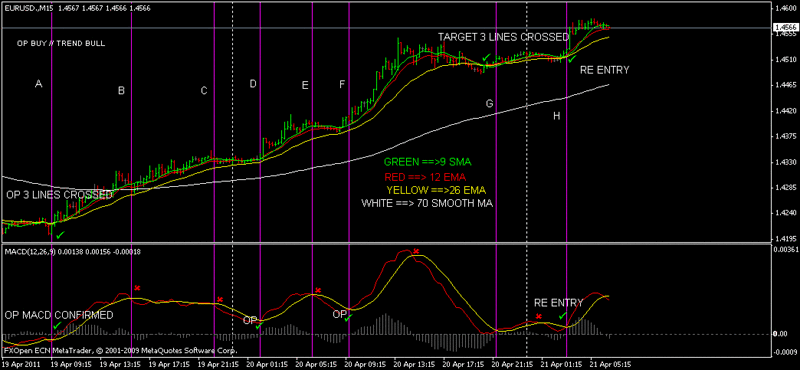
Forex trading strategy #45-A (MACD on the chart)
Submitted by User on April 21, 2011 - 05:45.
Submitted by martinnugo
I'd like to submit a strategy that crossed my mind when reading the strategy #6 (double stochastic) and #7 (simple macd crossover) the strategy is quiet simple actually.
We just need to move all macd line to the main chart which are 26 ema(yellow), 12 ema(red) and 9 sma(green), and we also can add 70 smooth ma(white) to determine the trend.
It looks reducing plenty of false entry signals. We can attach default macd indicator to make comparison. I need your view on this strategy.

I don't know how to explain it, but basically we just follow the trend and when the macd is confirmed we can op.
As we can see there are some unreliable signal from macd but with all macd lines on the main chart we can eliminate them. I attach just 15m screenshot, as I think smaller time frame is too emotional. I believe that you can add more explanation or modify this strategy. Thank you.
Regards
martinnugo
Edward Revy,
http://forex-strategies-revealed.com/
Copyright © Forex Strategies Revealed


"Dear all, is martinnugo using stochastic 21,9,9 in the indicator macd window1? i coundnt get the correct stochastic he's using.. the red and yellow stochastic.. any body help please"
You need to subtract/deduct 50 from the Stochastic results in the Sto chart before adding the Sto to the Macd. This will only give approximations. Why? Because the Macd window changes regularly based on the highest Macd high and the lowest Macd low in the window. Once a high high or low low has passed off the window, the size of the Macd in window appearance changes.
In MT4, the way to overcome this is to set the Macd window max height and min depth to a constant figure. This still won't help with the Sto (which is uniform all the time), but it will make things better.
Actually, there isn't any way to combine a Macd and a stochastic in any "standard" way. All of it will require customized changing. This is due to how different the two indicators are.
simple but awesome,u can take note of the important support/Resistant and psycho levels.
Thanks...
Dear all, is martinnugo using stochastic 21,9,9 in the indicator macd window1? i coundnt get the correct stochastic he's using.. the red and yellow stochastic.. any body help please
The MACD on the main chart as I described above is almost exactly the same as trading the MACD > or < the zero line on the MACD chart.
What works best for me so far - there are tons of things to try - is:
1. 2 MACDs: A = 17/18/9; B = 48/104/36.
2. If B is > its Signal, and;
A is > its Signal, and;
A last is < its Signal last;
Buy.
3. Reverse to sell.
4. EurUsd, 1-Hour periods, Limit 40, Stop 120.
5. If a loss occurs, open 4 positions at the same time next trade of the same direction.
6. If a win occurs, go back to 1 position next trade of the same direction.
(Direction means Buy or Sell.)
Simple as that.
Black,
Could you post a chart with comments how you trade the MACD signals in combination with closing price.
regards
or send me an email
www.vvsignaltrading.com
i use this method for M15 and bigger time frames and also additional stochastic 21,9,9. as for the entry trigger i use smaller time frame M1 or M5
I have built several indicators using this idea, and also an EA that is producing good results in the testing.
What you need to do is quite simple. After you calculate the MACD and its signal, you simply add them to the closing price. Then you look for 3 basic things:
1. Is the MACD higher or lower than the closing price?
2. Is the Signal higher or lower than the closing price?
3. Is the MACD higher or lower than the Signal?
Then you buy or sell accordingly.
Black
Hello Edward and others - Looks promising. This could act as a strategy to enhance the simple " 9 EMA " method.
Any comments ?
Brian
Post new comment