Trading method #2 (Parabolic SAR trading)
Submitted by Edward Revy on March 29, 2009 - 18:48.
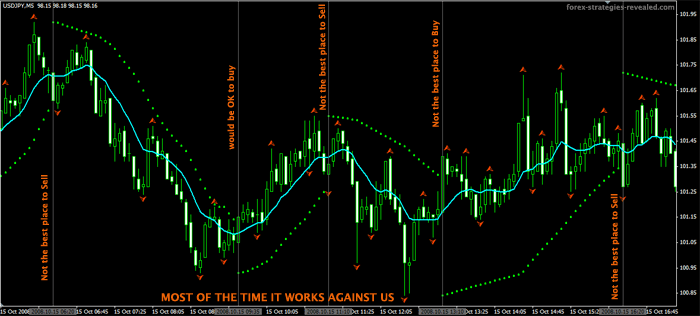
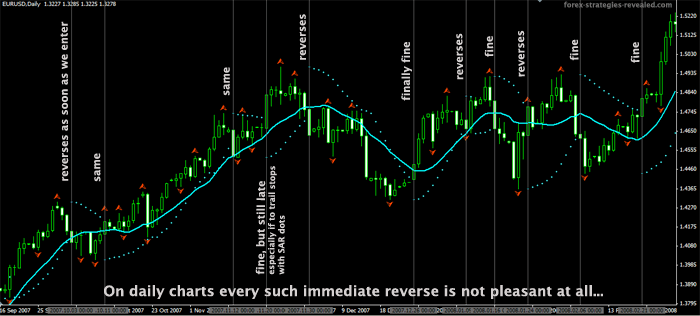
If you tried trading with Parabolic SAR for some time, you would notice that quite often, as soon as you enter a trade based on the first Parabolic SAR dot appearance, the market immediately turns against you, making your new trade start with a respectful loss.
Here is what I'm referring to:
Another example:
I have noticed that most of the times it is better to refuse Parabolic SAR first invitation and instead wait for a retracement to come. Price retraces about 80-90% of the time, which means that if you rush into a trade with PSAR new dot, 80-90% of the time you'll start your trading on a negative pips territory.
So, here is the question I haven't found the answer for yet:
What is the best way to catch that first retracement I know will come soon after the PSAR dot change?
Here is few raw ideas of mine:
1. Fibonacci retracement. With the first SAR dot, we skip the invitation to enter, instead watch price advancing, topping out (in an uptrend), then starting to descend, at which point we find the most recent swing high and low and draw Fibonacci retracement. The goal is to enter on 0.618 retracement. It is not a holy grail though...
2. There are Fractals and 14 SMA on both of my screenshots. So, what if we again skip the first invitation from Parabolic SAR, instead wait for price to retrace back closer to 14 SMA (or even touch it), as it does so, we go to a smaller time frame, where we will enter after the appropriate Fractal is formed.
As you can see, that's just an idea, but from my observations, it's the one you should remember about if you decide to chase a trade with Parabolic SAR indicator. I'm working on different versions to make things work with Parabolic SAR as it is a great indicator to trade with.
Edward Revy,
http://forex-strategies-revealed.com/
Copyright © Forex Strategies Revealed


Have you tried the fibonacci extensions? I have been using it to rake in some good profits.
Nothing says you can't vary the Parabolic SAR parameters instead of just taking the 0.02,0.2 defaults. I like to use 0.006,0.6 myself. The 0.006 acceleration factor means the dots take a while to approach prices, which avoids a lot of short-term reversals, but they keep accelerating towards prices anyway, for quite a long while.
Also, I'd like to see someone develop a Parabolic SAR indicator in MT4 where the dots will only reverse when a price CLOSE (not just a random spike) breaks the SAR line. That should take care of a lot of Parabolic SAR "head fakes." Any interested MT4 indicator programmers out there?
I'm a profissional trader.
I will just say thit because time is money: if YOU know something that happens 80-90% of the time than you have a draft of a system.
Look for probabilities and consistency. Forget all the rest.
Concerning fibonacci retracement, have you tried plotting the levels for the one candle at the first SAR dot reversal only ?
Ashraf
Hi Ettore,
it makes sense, why not. You're looking to confirm the main trend before pulling a trigger on a smaller time frame. EMAs are simple and effective tools to do just that.
Lastly, if making profits was out of reach for me and other traders here, we won't be dedicating our lives and time to trading Forex, at least I certainly wouldn't.
Kind regards,
Edward
Just to share an idea.
Sorry in advance if these things are obvious or non-sense for you but I'm inexperienced.
What if we plot a 9 and 3 EMA on daily and hourly EUR/USD charts. If price is above EMAs in these charts than we open a 5minute chart and buy if PSAR (setting: 0.2) give buy signal or as soon as PSAR give buy signal: stop loss 13 pips (a five minute candle moves usually 6-8 pips, so price as room to move but if we wrong we're out in 2-3 candles). As for take profit: 1.5x stop loss=19 pips or 2x stop loss=26 pips or do not set take profit just wait for 3-5 candles and then decide if close position or trail stop (if possible!).
If price give different signal in daily and hourly chart, follow hourly chart. So if price there is above EMAs buy on 5minute chart following PSAR signal: same stop loss but closer take profit 1:1.
Viceversa for sell.
Any comments greatly appreciated.
Last but not least, is there someone in the forum making money with forex? Thanks in advance for feedback.
Regards
Ettore
How about this:
First look for possible resistance level and wait for them to be validated.
If valid, enter.
As soon as possible move the stop loss to break even according to broker-fees.
After that wait for the chart to either rise/drop in your favor or against you.
If the stop loss is hit then you`re break even.
Only if the chart develops as expected you would adjust the stop but not immediately and not as quickly as SAR suggests. You leave more space for volatility.
i think psar same with tiny trendline, it's work for scalp.
A fairly simple approach would be to wait for the initial candle to close after the first dot appears & then take the entry only if price exceeds beyond the low or the high of that candle (obviously in the direction you're trading in). i.e. if you're shorting, then wait for the price to go lower than the low of the 1st candle which appeared after the PSAR gave a downtrend signal, given that the trend is still intact. I personally haven't tested this with PSAR, but have used the technique in multiple timeframe trading for timing entires on the shortest timeframe. ERB.
The PSAR only works if you're a SWING TRADER., Not A DAY TRADER, Also it works with 15 minutes, H1, etc. But here is the different with the PSAR. Its the timeframe, you see i am a forex trader with Liteforex. liteforex default timeframe is 4 hr. SO basicly 98% it will be mostly SELL, now on a 15 minute timeframe it will say BUY, So yes it work on different timeframes but signals are NOT the same, as you may think.
Neat idea Edward.
I, for some reason, see potential in the dots though I have not found a way to profit from them.
Your fib retracement idea has me intrigued.
I am experimenting with buying a 50%/62% fib retracement after the swing high has been reached on the bullish break of a dot.
I'll keep you posted.
Michael
HI EDWARD
I AM HAMID ,THANK YOU VERY MUCH FOR YOUR STRATEGE (TEMA& PARABULIC SAR).
for enter you can using higher- high or lower low. If it's apper- order, if not h-h or L-L, but Parab SAR show signal-- just wait second wave.
Hi Xander,
The dot is permanent after the CLOSE of the candle, not at the open, where it can change.
Here is the screenshot to explain what happened:
So, your strategy should be based on signals taken after a candle is closed, and a SAR dot got its permanent position.
Regards,
Edward
Post new comment