
Advanced system #8-a (4 CANDLES STRATEGY - BETA)
Submitted by User on November 22, 2009 - 14:27.
4 CANDLES STRATEGY (BETA)
NAME: AYETEMIMOWA JAMES FEMI
SITE: www.bondfx.biz
http://bondfx-market.blogspot.com
EMAILS: [email protected]
[email protected]
Its good to be here again after a while of hard research work. I believe in simplicity and money management - good MM i mean. Anytime I move away from those two facts, no matter how good the strategy may be, I will fail.
December 23, 2007 I came up with "4 CANDLES STRATEGY" on this website and special thanks to all the followers, critics and Edward the moderator.
This 2009 I have come out with this "BETA" version and this time I think its better, cleaner, and profitable with good money management.
I will do a comprehensive explanation on this site and daily analysis with free trade signals will follow on my blog http://bondfx-market.blogspot.com on daily basis. Please Enjoy it.
Before you read further please review this risk warning:
"Trading foreign exchange on margin carries a high level of risk, and may not be suitable for all investors. The high degree of leverage can work against you as well as for you. Before deciding to trade foreign exchange you should carefully consider your investment objectives, level of experience, and risk appetite. The possibility exists that you could sustain a loss of some or all of your initial investment and therefore you should not invest money that you cannot afford to lose. You should be aware of all the risks associated with foreign exchange trading, and seek advice from an independent financial advisor if you have any doubts."
TRADING PLAN
CURRENCY PAIR: ANY
INDICATOR: STROCHASTIC (5,3,3)
TIME FRAMES: 1HOUR AND 15MIN
SAMPLE PLATFORM: MT4 (LITEFOREX.ORG) with this you can check the broker time and adjust with your broker's time.
SETUP:
I will be using Friday November 20 2009 as an example and will be analysing EUR/USD today
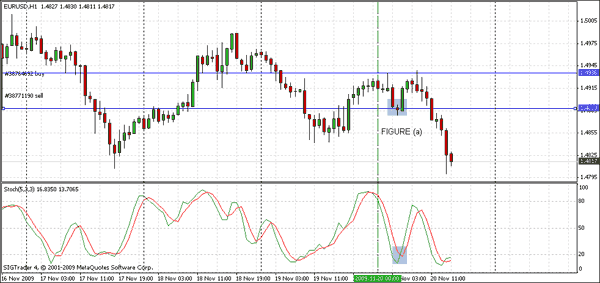
Your chart setup should look like figher (a) below. The blue horizontal lines shows the highest and the lowers level of the first Four(4) candles of the day. You need this for visual aids. At the touch of either of the lines by price. It stochastic is Over sold or over bought, then NO TRADE. If not, then check if the direction of price and stochastic are the same. If stochastic is pointing down and price is touching the lower line then you have a change to trade SHORT and conversely for LONG.
A careful look at the chart figure (a) at 2009.11.20 04:00 the price touched and closed below the lower line for SHORT, but stochastic over sold, then NO TRADE. So we wait or forget trading with this strategy for the day.
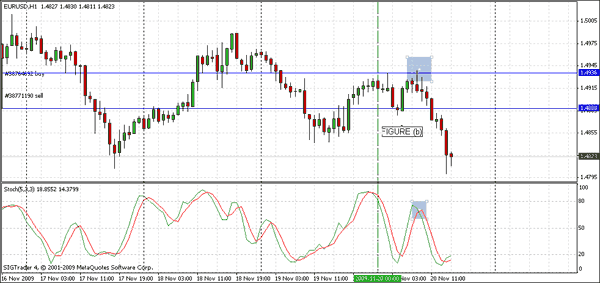
A look at figure (b) price touched the uppline 2009.11.20 08:00, and stochastic in same direction. Then potential LONG trade. So we move to the 15min timeframe.
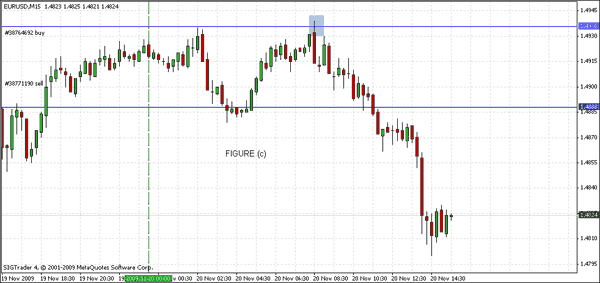
In figure (c). We have a NO TRADE as price refuses to close above the upper line.
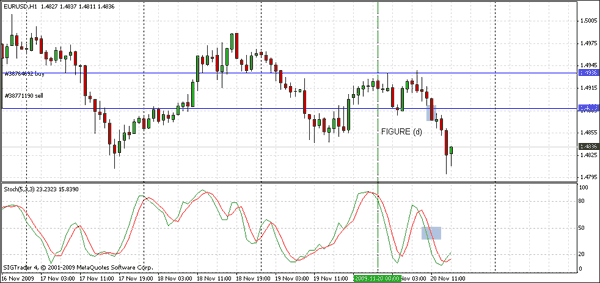
Now figure (d) price touched the lower line at about 2009.11.20 11:00 on the 1hour timeframe and stochastic not over sold - then a potential LONG TRADE.
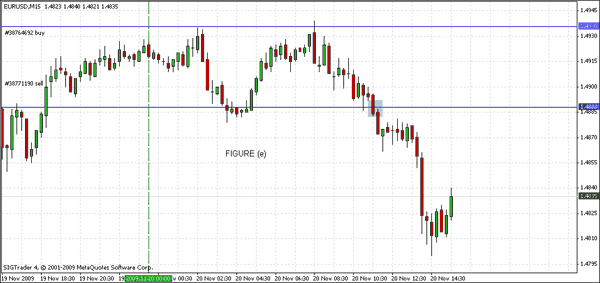
Move down to 15min timeframe as in figure (e). Price closed below the line at about 2009.11.20 11:30 and few pips below the low of this 15min candle is our ENTRY for SHORT trade.
EXIT:
The distance between the two horizontal line in pips value can be your TP and SL. A good understanding of fibonacci or pivot can help you too. I use fibonacci. DONT FORGET MONEY MANAGEMENT, i mean your risk exposures.
I hope you will enjoy this strategy and if compared with previous version, you will see a good improvement. I will also welcome your comments
Daily analysis of the currency market with this strategy on http://bondfx-market.blogspot.com with any pair, showing recommended support and resistant points. A comprehensive analysis of my "POWER TREND" strategy will also be available daily on my blog. I welcome your comments.
MAKE PIPS, KEEP MONEY.....
JAMES.
Edward Revy,
http://forex-strategies-revealed.com/
Copyright © Forex Strategies Revealed




James isn't here anymore as far as I can see.
My opinion about the questions is next:
- if you missed the first breakout and within a few hours the market gave you another breakout form the same 4 hour candle range, why not take it?
- The hourly OB/OS conditions are important, while the 15 minutes already not. As I can see from the screenshots the 15 min charts focus on the breakout channel, and there is no Stochastic. I agree with that: 1 hour is for taking signals, while 15 min is for precise entry for the ALREADY RECEIVED signals. Need no confirmation no more.
Hello James, I have a quick question. Are we only taking the trades on the 15 minute chart? and another question is that if the stochastic is not on the OS/OB on the 1hr chart, but is on the 15 minute during the 4 hr candles, do we trade or not?
What the conditions are met on the hour chart and then when you go to confirm on the 15 min chart, the stoch is in oversold or overbought territory, do we take the trade or not? because I believe you only mentioned that on the hour charts. Secondly, are all the trades going to be taken on the 15 minute chart?
Hello James! I am Radu and I want to ask you if can take orders later in the day, even if the candlestick already makes a valid breakout, let s say downwards and after a few hours turns up and go another breakout on the upper side or again go down. I mean if i get up to late and i can't take the first signals. Thanks!
i put on this strategy and from 5 signals none of them confirmed
Hi James..I had used your old system with success, then went away from it and am now back and will not go away from it again. My goal is to average 40 pips ($400)per day and this is the best way I have found to do it, after trying many different methods.
I use RSI instead of Stoch and must have confirmation of direction on weekly, daily and H4 timeframes. I scan all pairs for this confirmation which generally narrows the pairs to about 5, then I analyse these pairs using the original 4 Candle system. I average two winning trades per day and generally meet my goal except when greed pushes me to hang in longer. Thanks for this truly simple, but winning system. Rebecca
Hello,
YOu can still follow the old strategy this is just a more improved version. As for the time use the litefx.org platform. You can use the time on that platform as your time or to adjust your time.
Major pairs are good, but for crosses you need a lot of work. The two major pairs that make up the crosses must be in same direction to help you well.
Enjoy.
James
Seems to be a good strategy. Thank you James for sharing it!
I think there has been a small typing error when you were explaining figure d as the opportunity is for a potential SHORT trade.
Secondly, is there any specific reason for removing the 4H check that you had in your previous strategy.
Thirdly, again the problem people had with your previous strategy as to when does your day actually starts. What time frame are you using or you think is best for this strategy to work, relative to GMT?
Also, in you personal experience, do you think this strategy would work better with the GBP/JPY and other xxx/JPY pairs?
Fahd
p.s. Special thanks to Edward for giving us this great forum. May you have many pip-filled days!
I have not done much backtesting on it yet, but so far it seems to be a very promising system. Worth taking some time to backtest. I would like to demo test it, but I cannot traded during the first 4 hours of the day.
We look at the two lines. I think that solves the problem!
James
Hello,
If you look at picture b, price touches the upper line and stop was in good shape for BUY, then picture c is the next check. In picture c price refuses to close above the upper line so, that nullifies the BUY intention, then the SELL came up and was successful.
NOTE: I dont use this system a day the range between the 2 lines is more than 40-45pips. THis is bcos your stoploss might be too unreasonable.
James.
Hi James thank you for this strategy and thank you Edward for everything.
I would like to say that in pic b, as the price touches the top of the upper price line of the 4 candles, one of the 2 lines in the stocastic had a down slope movement, only one was pointing up and the strength of it was weakening. Now do we only look at one of the lines of all of the 2 lines. thank you
kar lok
Post new comment