


Advanced technique #9 (System Selection Technique)
Submitted by Edward Revy on September 18, 2008 - 10:21.
Choosing the right strategy for trading is a strategy by itself. (from Edward)
All credits and special thanks to Arsalan, the author of this technique.
--------------------------------------------------------------------------
Hello everyone and thank you Mr.Edward Revy for publishing my ADX+EMA SYSTEM.
I want to share one very good idea with everyone.
This is not a trading strategy but a technique to determine which system to use and when. There are many systems available to use some are trend following systems like moving average crossover and some are oscillator based system which utilize indicators such as Stochastic, Rsi and William %R but if all these systems are good then why they work sometimes and sometimes they fail?
The reason is selection of a good system at wrong time.
We can overcome this problem with the use of one simple indicator ADX(14)
The level of ADX can help us to decide which system to use at a given point of time.
Now let me explain you how to accomplish this goal.
PLOT ADX(14) ON CHART FOR YOUR CURRENCY PAIR.
IF...
1)ADX is below 20 - USE OSCILLATOR BASED SYSTEM(RSI,STOCHASTIC ETC.)
2)ADX is above 30 - USE TREND FOLLOWING SYSTEM(MOVING AVERAGE,MACD ETC.)
3)ADX is at 45 or above it - BOOK PROFITS.(Wait for new entry)
4)ADX IS RISING FROM LEVEL BELOW 18 AND THEN GOING ABOVE 23 - USE TREND FOLLOWING SYSTEM.
5)ADX DECLINING FROM LEVEL ABOVE 30 AND THEN GOING BELOW 27 - USE OSCILLATOR BASED SYSTEM.
The above mentioned method will help you select right system at right time. This system selection technique works very well according to my experience.
I want to tell you again that this technique only helps to select right system at right time and it is not a holy grail.
I hope everyone will like this system selection technique and use it to improve their trading.I use this for trading in stocks and hope it will work well in the forex market.
A GOOD SYSTEM NEVER FAILS IT FAILS ONLY BECAUSE IT IS USED AT A WRONG TIME.
Happy trading,
Regards,
Arsalan.
-----------------------------------------------------------------------------------------------------
Greetings from Edward!
As an update I'm posting a screshot and explanations to it, to help everyone to understand this great method from Arsalan.
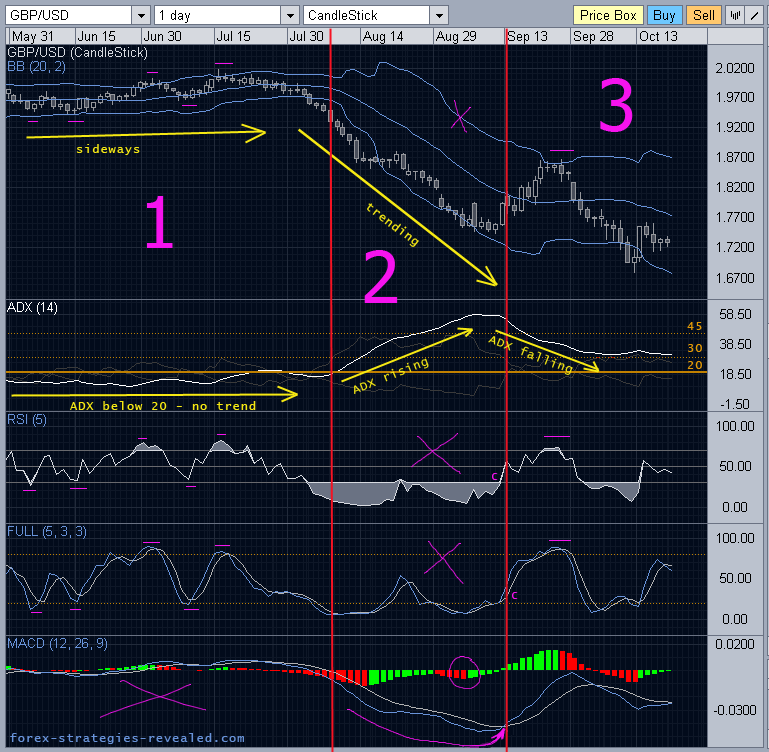
There are 3 blocks:
1. The market is moving sideways
2. The market is trending
3. The trend is weakening, re-evaluation of forces begins
Block #1:
The market is moving sideways.
We can simply see it, but also we can get clues from ADX indicator, which now stays below 20.
Signals of which indicators should use for trading in this conditions? We use everything but trend indicators:
- Bolliger bands - the price will bounce off BB levels.
- RSI - react to oversold/overbought zones
- Stochastic - Stoch crosses, especially those in oversold/overbought zones.
As you can see in Block #1, they all give true signals.
Unlike MACD, which is revolves around zero line, crossing back and forth. It is useless.
Also Moving averages (which I didn't put on the chart, it is too messy already :), they also will give false signals, and thus should be ignored.
Block #2:
The market is trending, which is confirmed by ADX, it moved past 20 and is rising.
What indicators and systems to use? Use trend following indicators obviously:
- MACD is good.
- Moving averages would be good.
Unlike now RSI and Stochastic - they will remain in oversold /bought zones (depending on a trend) for a long time.
Unlike also Bollinger bands - the price won't obey its boundaries anymore.
Now, ADX reaches 45 - it is time to think about collecting or protecting profits. The trend is mature. We look for the clues from our trending indicators. In this case the earliest signal is received from MACD histogram (circled in purple), which changes color from red to green. Later confirmation for those who missed, comes from MACD lines crossover; and even Stochastic and RSI finally come out from oversold zones (small letter "c" - confirmation - on the chart).
When traders are out the trend begins to weaken, ADX starts to fall, price retraces upwards.
Block #3:
- ADX is falling, which means the trend has gone, at least temporarily.
We don't know whether it is going to continue or not, so we seek advice from indicators, but not a single one - a group of them.
ADX in this case becomes useless until it begins to rise again.
Why? While ADX is falling two things may happen: first - the trend will take a break - ADX will continue to fall; second - the new trend (uptrend in our case) may begin sharply - ADX will also continue falling only confirming that a downtrend is weakening yet more. (During sharp turns in the trend ADX is late with a responce, a recognition of new trend. During slow turns it is accurate.)
So, whether a new uptrend begins sharply or an old downtrend weakens, ADX will show the same tendency - it will fall suggesting no clear trend... That's why we don't use ADX when it is falling.
So, later in block #3 we get a strong Sell signal from all 4 indicators:
- price meets BB and retreats,
- RSI overbought,
- Stochastic overbought,
- MACD histogram has changes from bullish to bearish.
That's a signal to Short.
I hope you followed me through without difficulties.
If not, feel free to ask me or Arsalan any question about the method.
Happy trading!
Edward Revy,
http://forex-strategies-revealed.com/
Copyright © Forex Strategies Revealed


Hi Arsalan
Iam a nifty trader - Can u share ur email id
Please read this first....
ADX indicator scale
If ADX is between 0 and 25 then the stock is in a trading range. It is likely just chopping around sideways. Avoid these weak, pathetic stocks!
Once ADX gets above 25 then you will begin to see the beginning of a trend. Big moves (up or down) tend to happen when ADX is right around this number.
When the ADX indicator gets above 30 then you are staring at a stock that is in a strong trend! These are the stocks that you want to be trading!
You won't see very many stocks with the ADX above 50. Once it gets that high, you start to see trends coming to an end and trading ranges developing again.
thanks a lot for sharing your system
Hello mr Edward Revy and mr Arsalan
Many thanks for your work!
I have read this article and comments on it, but i still have some questions:
1)which ADX settings are better for the smaller timeframes, e.g. H4
2)are there any other similar techniques for the smaller timeframes, e.g. H4, H1?
Best regards,
Serg
wow. interesting.
any results on the demo trading?
hey i checked it it works fine. ill use it on demo account first and check again. hanks for sharing
I am searching for this type of system this system is very use full all day traders
I dont know if this is true or they are comments from market makers.
I SURFF TO MUCH FOR PROPER GUIDENCE BUT NOTHING,BUT THIS SITE HAD GIVEN ME TOO MUCH REALLY VERY GOOD NO NEED TO USE ANY OHER SOFTARE FOR TRADING.IT ALSO PROVIDE GOOD INPUT DATA FOR SETUP TECHNICAL ANALYST
I MAKE A META FILE BUT IT NOT WORK NO ACTION WHY IS THERE SPECIFICALLY PERFORM SOME PAIRS ?
I neve knew I have been missing all the while, ignoring ADX.
Thanks a million.
Adyreal.
Arsalan, Thank you for sharing all of this informaion. I have been trying to reinvent the wheel for some time, and the information on this site along with Edward's examples have been an tremendous help.
David
Great job,
Thank you Brooky!
Regards,
Edward
This is the chart with the Brooky_Indi_Select.mq4 indicator loaded so you can see how it portrays the info.
Cheers
Brooky
Hi Arsalan and Edward.
I have enjoyed reading many of your strategies and have found that underlying nearly all of them the knowledge of what indicators should be weighted is crucial.
I have attached an indicator I wrote that attempts to graphically portray the concepts that Arsalan has put forward here.
I have used it to great effect with other strategies that I use and as a way of giving back to you I attach it here. I have attached the same period chart as yourself but with the indicator attached so that people can relate to the same info.
I hope you find this useful as I have.
One thing worth noting is that when using Mt4 (Metatrader) the ADX must be set to 28 to emulate what Arsalan has as his Adx 14. This I believe is a known issue with Mt4.
The indicator is bound to a 0-10 range and has a legend that explains the color codes so that people can visually see whether they should wait, look toward oscillators or trend indis or take the money and run :-)
Hope this is useful to all.
Cheers
Brooky.
Brooky_Indi_Select.mq4
Post new comment