Advanced strategy #10 (Trend Line Trading Strategy)
Submitted by Edward Revy on October 4, 2008 - 08:30.
A truly great work has been done by Myronn, the author of the current Trend Line Trading Strategy.
Support-resistance trading, trend line trading, checking higher time frames, money management — the strategy has a concrete-like theory base and a simple implementation — a winning combination, that places it into the category of advanced strategies.
Remember, your feedback, comments and suggestions are always in great demand!
Edward Revy
Read entire post >>>


Hello all,
I think it will be worthwhile to present a brief summary of this week's trading(6th-10th Oct 2008) results using the trendline trading strategy:
Total Trades Taken=62
Winning Trades=39
Losing Trades=21
Break Even Trades=2
Therefore 63% success rate.
Largest Winning Trade=$5381
Largest Losing Trade=$3884
Winning Trades Total Amount=$51,003
Loosing Trades Total Amount=$19,805
Net Profit This week =$31,198
Total Profit to date stands at $39,859. Thats a 797% return on a $5000 trading account in 2weeks.
Attached is a screenshot of the account summary.
Regards
Myronn
TRADING LESSON #4277
TRENDLINE BREAK.
This is euro Thursday where I lost money. It is my fault. I was trading 15 min charts but having daily chart profit expectations.
Shown is 1 hr TF. I set my stop too low for the TF, I should have made it @ least 1.3600. I also saw it at 1.3680 before I left for lunch, I could have moved stop to even or small TP. I think now that this is the key to the system. After it makes it’s move, then UNLESS the TL is broken, it shouldn’t come back to your price.
Another thing I was taught that you should think of TL’s as drawn with a thick crayon, they may respect the trend but not the exact number (the candle before my entry in point—it’s a bit lower than the line) but it’s still no reason for such a low SL. In any TF, 1.3600 would have sufficed, and certainly moving it to even would have put things to the positive, even slightly like I did with the S CHF the other day.
If you look at the beginning of the trend, you will see that it touches, and then GOES. In reality, right away you know you are either right (and the TL will continue) or wrong. There is no middle ground, no indecision.
This is more a factor of my getting used to small TF’s than the system. I ned to still think of scale, of R multiples, 25 pts risk vs 60 I had is a 2.4R. 2R is a good goal.
BTW, the orange down triangle was a short I had looking on a 5 min chart, when I went to 3 hr I saw I was counter trend AND at the TL so I reversed it.
One last thing before I go. I shall speak later, but I have an idea to see if you can make the kind of money you are talking about.
Grant,
I know there is such a thing as a flat trendline...and when price is going nowhere, what strategy can be applied? Simple observation tells you that when price is going nowhere, sooner or later there is going to be a breakout. The breakout happens often in the direction of the main trend.
You are doing well Grant! Doing good! Doing good! Keep going.
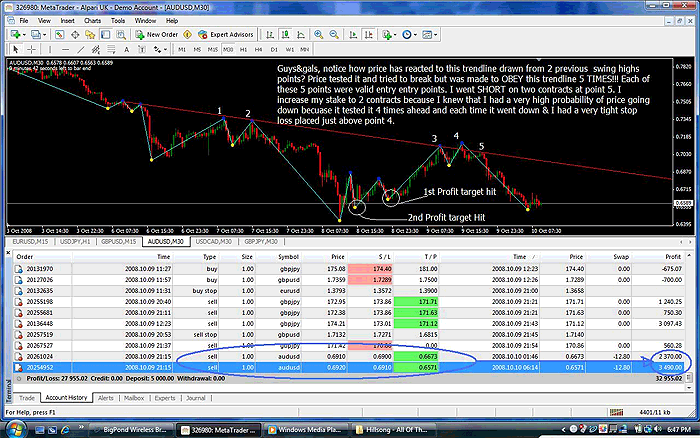
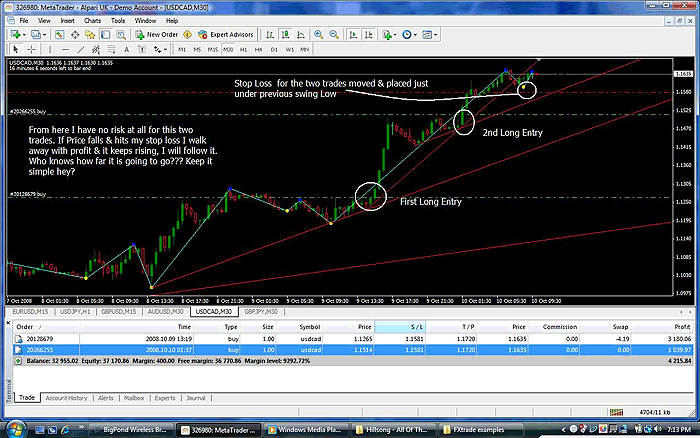
Attached are 2 example of some recent trades I took. During the week, I placed some trades that went against me & hitting my stop loss. But the gains outweighed my losses & so far so good:560% return on the money in two weeks is not bad using a simple trading strategy. Can 50K be achieved within a month with a 5K trading account? I dont know, I've never done it before. I will stick to my trading system & see where it takes me.
The first chart shows two short trades I took on the AUDUSD.
The second chart shows 2 current long trades that I took on USDCAD. I will trail it & see how far it goes. I want to see if Santa has a surprise for me.
(Click to see full size image)


Regards.
Myronn
More work has been done Myronn!!! The learning continues.
Firstly, to the ‘user’ question regarding live or demo, I trade this theory live. It’s close enough to my system that I have confidence it works. Actually, Myronn has hit upon the fractal nature of trading.
When I made the mistakes that I did yesterday and today, it was real money. I find I learn a whole lot better when it’s real. It wasn’t a lot. But when you know those numerals on the balance sheet come from your hours of day job work, you learn. It’s like taking responsibility for your actions—when you do, chances are that you will not do the action many more times in the future.
“Good judgment come from experience and experience comes from bad judgment”
Back to the fractals. Somewhere on the internet-- "Fractals are a rough or fragmented geometric shape that can be subdivided into parts, each of which is (at least approximately) a reduced-size copy of the whole. Fractals are generally self-similar and independent of scale."
Myronn, the other day I was looking at 1 min candle charts looking at patterns, sharpening my skills. Never in a 100 yrs would I think of trendlines and trading on smaller time frames.
On to the trading. I made a few mistakes and would like to comment.
Think of the big trend first. Y’day I was S CHF. I had 120 pts in the bank and left it. When against the big daily trend , book ‘em Dano. I still got 30 pts, but that’s 25% of what I had.
Thursday, today, I knew was going to be hard. Looking at daily charts, most were counter trend or undefined by the time I woke up. Thinking back I should have used the demo acct today. That is another thing too, knowing when things aren't going to go well and taking the day off. I had all three trades change trends. I hadn’t looked at the big pic for the first 2, and for the last one L EUR, it was too late in the day for volume, movement and of course it was counter to the daily trend. In all three I could have liquidated at one or more points for profit. It’s the ‘not good at scalping thing’. Also the stop loss should be an indicator of a changed trend. If the trendline is broken, the trend is too. I need closer stops. Not problems with your system, but the end user.
And lastly:
I disagree with the assumption this doesn’t work with ranging currencies. What you are doing is entering at support or resistance and exiting before it hits the other side. It’s just a flat trendline Myronn!!!! A rising trendline is moving support, it’s just at an angle. Edward will tell you a trending market is so nice, you don’t have to work like we do during ranging ones. March to August was like that. I made money in CAD, but 100 pts at a time, waiting for it to hit S or R, fearing a breakout against you, thinking the trends will never come back. Trending is like the gravy or dessert because you earned it. That’s why its important to conserve capital for the good days.
Ranging is different than choppy too.
That's all for now.
Grant
i get it now. Thanks Thomas.
And I'm no computer guy (just a chart looker)
Grant
Hello all,
just REMEMBER that this strategy works very well in trending markets. If you cant identify an obvious trend, best advice is stay out unless you have another non-trending trading system under your arsenal that you can utilize.
A little tip: sometimes, when I look at the 1hr(for example), I cant see an obvious trend: the market may look to be in a congestion or going nowhere. But when I switch to a much smaller timeframe like the 15mins or 5min timeframe, I tend to see trending inside those smaller timeframes which I can used to collect a few pips here & there.
Happy trading.
Regards.
Myronn
Okay, Myronn, I'm mad.
Working and playing. I am still S CHF @1.13409, which is good. As I write, that's 63 pips.
BUT, the MAD part:
I said that i could have, using your system (and my judgement) bought and sold 5x. Well, it was 4x and I added up the pips and it works out to 115.
I think it's 2 lots tomorrow.
Grant
Hey Myronn
Playing with your sys in real today. got an interesting one. right now almost 11am EST. CHF on a 5 min is doing exacly what it should, BUT, its hitting support (six times) @1.1310, the low of the day. its making a wedge, which usually breakout in the direction of the trend which is dn.
Remember the CAD and JPY breakouts?
I have my orig lot, which i could have bought and sold 5x already. I'm just not a good scalper, I guess. If i had 2 lots, i could hold one and scalp the other.
Trying to upload some pics, but in the meantime . . .
. . . keep right
Grant
Did you implement this strategy into live trading or just as a demo? If you are currently trading a live account, I would like to know how long do you test a strategy before starting to use it in real account?
Thank you for your valuable information.
(Click to see full size image)


Hello all,
good to see some comments on the trendline trading strategy. To the user who submitted a comment on stochastics, (that reminds me, could you pls put your names/nicknames whatever so we can address you as a person pls & not a faceless characters becuase i understand you are flesh & blood like me)
It you can futher refine this trading strategy by using a certain indicators to filter entries & if that works for you fine, then that is good.
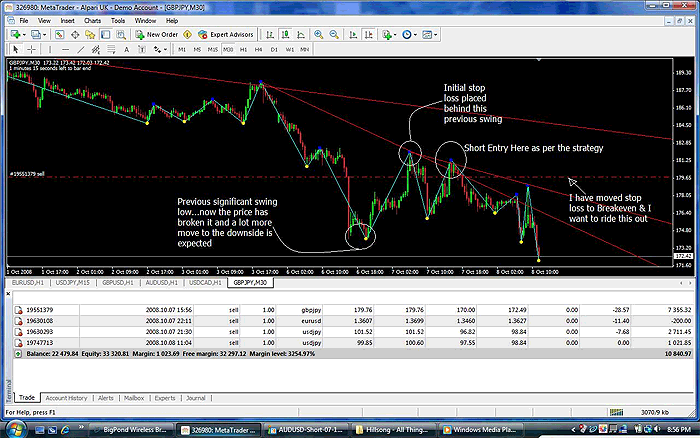
Grant, I agree completely with your comments & on letting profits run & to illustrate the point I have attached a screenshot of GBPJPY that I went short on, I have place profit target on a significan support level furhter down. The significant previous swing low has been broken & and i expect the price to continue heading down.
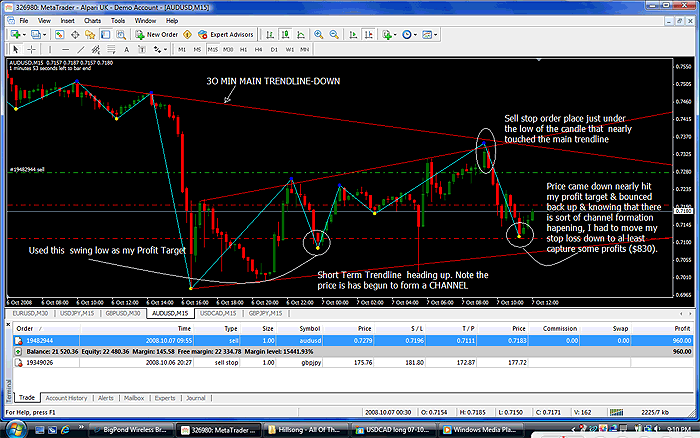
Also attached is a screenshot of a short trade I took on the AUSUSD.
Regards
Myronn
PS: My background???? hammering nails seems pretty close...lol.
Very nice work Myronn!!! Just what I was looking for. Simple, effective and timeframe independent.
Just a couple of ideas to help tweak it.
1) We never know where the bounce will take us. Follow the trend and the trend is the trend until the end. Cut your losses let the winners run. Profit targets are nice, but it's like knowing what Santa is going to bring you. Why not keep things interesting? Let things run. You are with the big, mid and small time trend, so who knows where it will go?
This CAD illustrates the point, and if you look at your added JPY you will see the same. You sold just before the big drop.
There were no candles that said that things were turning, so why not just trail the stop?
I made a big mistake a while ago that I will never forget. In the Euro pic, I was long.
This was when it was ranging, but trending up, I rode up and down three times 100+ every time. Great. My exit strat was when things were oversold, I would dump it. As you can see there were three days of indecision around 1.48 where I sold. I had bought around 1.4450 so had about 350pts. I was happy. Then it went up and up and up and didn't stop or retrace until 1.59, 1100pts later. Whatever size your lot, that is a big difference. It tasted bitter. I learned it. Learn from my mistakes, please.
There are three sides to making it in this business-- trade strategy, risk reward, and money mgmt. I am confident you have the first, maybe the second looking at your profit/loss pics, bigger winners than losers, but in real life you need . . .
2) Money Management. The 2 books that made the most difference in my trading longevity were by Van Tharp and Curtis Faith and they deal at length about position sizing and risk reward. Position size is often hard with a small account, but there are some brokers like Oanda that you can size your lots as you like, rather than in 10k or 100k lots.
I risk no more than 4% on any trade, usually I go 2% so I can trade correlated markets (which is most everything these days). 4% of my Balance goes to not the leverage, but stop loss.
Example. You have $5000 balance. You see a trade that calls for a 80pt stop. How many lots can you afford?
4% of $5000 = $200.
Then divide the $200 you can lose by the amt of pts, 200/ 80 and you get 2.5 lots. (minis) On Oanda, I can do this, but if you have standard lot sizes, I would suggest rounding down to 2. Say your R is 2 (Risk reward is 1:2). You make $400. Balance is now $5400, so 4% is $216. That is the power of compounding.
An option for this is to liquidate half at that PT and let the other run. Best of both worlds.
I have made more money using smaller lots and larger stops than larger lots and smaller stops. Before Oanda, thinking of a 100pt stop made me sweat.
Van Tharp just came out with a whole book on position sizing worth $150. I sold book reports as a kid, now I take paypal for my synopsis of trade methods. The account number is . . .. just kidding. Buy me a bottle of good rum on your first million.
Myronn, I don't know what your background is, stocks, commodities, hammering nails, but this idea is good. Put it all together and you will do well.
Pura Vida
Grant
Hi Myronn,
I use stochastic as a filter in this strategy.For short entries i look for overbought zone when price intersects trend line and for long entries i look for oversold zone when price intersects trend line.I avoid all long entries if the stochastic shows overbought condition and avoid all short entries if stochastic shows oversold condition.I use 1 hour chart and 10 minutes chart.I go short when all the condition for short entry in your strategy is confirmed and stochastic is above 65 and I go long when all the conditions in your strategy is confirmed and stochastic is below 35.
Hi Arsalan,
Open your charts full screen.
Then press Ctrl + Print Screen. A picture of your screen is now if your buffer.
Then create a file, for example, Word document.
Paste it there: Ctrl + v.
(Or use Adobe Photoshop and edit image there).
Save it and send it to Edward:

He'll post it here for you.
Thomas Andreas
(moderator)
Hi Myronn,
I have made a profit of 95 points on Nifty today using your strategy .I decided to use it on Nifty after reading the review of the person who made $1100 profit using your strategy.This strategy is really mind blowing and i want to post the image of the trade which in which i have made profit today but can you please tell me how to copy image from the trading software and post it on this website? I have tried to copy the image but it comes in .tml format and not in .jpg format.
I hope you will reply soon.
Happy Trading,
Regards,
Arsalan.
Post new comment