Forex trading strategy #16 (Picking tops and bottoms on Bollinger Bands)
Submitted by User on April 15, 2010 - 15:55.
Submitted by Lino
Picking tops and bottoms on Bollinger Bands
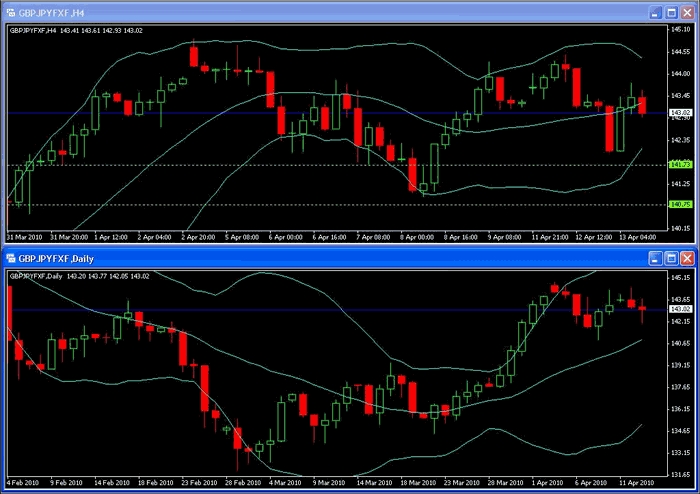
By using multiple time frames and candle stick formation we will uncover how to pick tops and bottoms while trading in the trend of the bigger time frame.
We begin by looking at the daily chart to ascertain what direction we looking to trade by using the common Bollinger Band indicators middle line. A pair trading above the 20SMA is in short term up trend. A pair trading below the 20SMA is in a short term down trend.
Once we find our direction we move to the smaller time, 4hour and 1hour, there we look for weakness in a uptrend (touch of bottom bands) and strength in a down trend (top of bands).
Cheers Lino
Edward Revy,
http://forex-strategies-revealed.com/
Copyright © Forex Strategies Revealed


Hi. I also cannot understand when you say weakness in an up trend. Willy.
If the market is in a sideway movement it's an excellent trading strategy. I like so much the more in combination with the CCI(14) Tops & Bottoms.
Simple, fast & efficient!
Kindest regards
Sam
hi,I used your strategy in my trading and earn handsome money.please keep me updated.
Hi Newboy
Sorry for not posting. Iv been rather busy.
If you google gimme bars, inside bars and pin bars, it will explain exactly how and where to enter. Gimme bars from trading naked also uses Bollinger Bands.
Origanally I posted taking direction from the 20SMA, you can find that from Uncover Forex Profits With The Turn Trade
by Kathy Lien and Boris Schlossberg. Its a good concept, only it too has many false signals, especially in a strong rally.
Start with daily, get your trend, you can even use a bigger MA if you feel more comfy, then wait for reversals at tops and bottom of smaller time frame bollinger bands.
It is not dead of course, it is up to us, forex enthusiasts to make it lively and relevant by contributing and participating actively. I hope Lino replies soon as I find that MTF method is rather promising but I failed to understand her narration correctly. NewBoy.
It's not dead, but it's slow.
I'll pick it up from here if the author of the strategy won't return to support it soon.
Regards,
Edward
I don't see any movement, reply on this thread...is this thread dead?
Hello Lino,
I tried using your method but could not get it right...would you mind explaining a bit more detail about this method. Thanks so much/NewBoy
hi want to ask do we buy when the price hits lower bollinger banda and sell when price hits upper bollinger band i got a site with conflicting info am a new trader and ad like some clarification please
Hi
As you can see on my example, open 2 window with daily and 4H, place a 200EMA on both daily and 4H. I say 200EMA just to give you an example.
Now, If price is above the 200EMA on daily, for at the 4H time frame and see how long the price bucks the 200EMA before resuming in the daily uptrend. When the 4H is below the 200EMA, its bucking the trend.
It gets tricky to know exactly when to enter, but I personally use the 1-2-3 setup, or candle stick reverse bar off the bollinger bands.
Hope that helps
what do you mean by a weakness in up trend and down trend?
Post new comment