


Forex trading strategy #17 (Trading Off the Daily Chart)
Submitted by User on March 23, 2012 - 07:49.
Submitted by Adam
Many traders love the allure of the volatility of the forex markets and prefer to trade intraday by opening and terminating positions within the hours of each other. Trading the daily charts is not very common because many traders lack the necessary patience to follow a trade for weeks on end to its logical conclusion. There are many things that a trader will gain by trading off the daily charts.
In the first instance, we must be very familiar with the saying that the trend is our friend until it ends. The only way to determine the true trend for a currency is to look at the daily chart. A typical daily chart snapshot will show the price action for weeks at a time. You can then tell just by looking at the chart to see whether the trend is up, down or ranging.
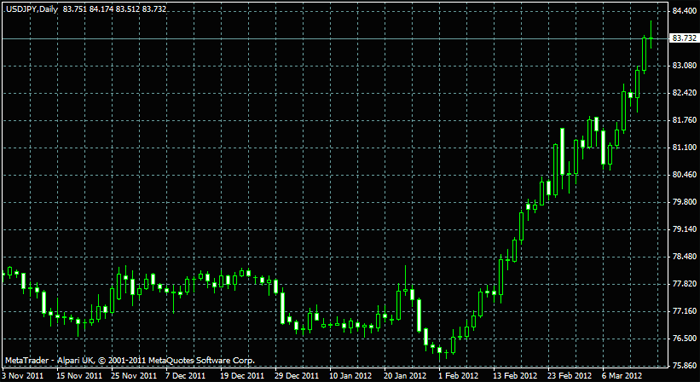
The chart above is the daily chart for the USDJPY. It is very clear from inspection that the currency pair is in a very strong uptrend after a long period of consolidation that lasted close to a year. Using short term charts will not give the true picture.
Trading off the daily chart will reduce the frequency of trades, but will also allow the trader more time to assess a trade setup and trade it with greater certainty. Trade targets are larger, and a trader can make money from a few trades that will far outstrip what he will make by chasing pips all over the place.
One trade I love to take off the daily chart is the retracement trade. Pullbacks are a normal part of trading because there will always be early bird traders who got into positions very early in the trend and will be looking to take some profits off the table. When they offload their positions, the price action of the currency will retrace.
Now I am usually interested in the continuation of the moves in the direction of the trend. For me to do this, I need to know where the retracement will come to an end. With 5 points to choose from the Fibonacci retracement tool, I need to get a clear idea of where to make my entry.
The tool I have found most useful is the Stochastics oscillator. When it crosses at overbought or oversold levels, it gives me a clear indication of exactly where to make my entries.
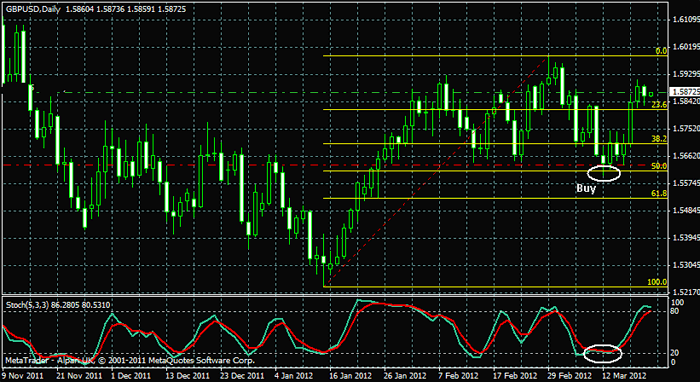
From this daily chart above, the Stochastics crossed at oversold levels of 24.1 at the 50% Fibonacci retracement line. An entry here would have produced 250 pips as at the time of writing this on March 20th 2012.
This is a simple strategy that works all the time. Trade the retracements off the daily chart.
This Forex trading strategy article was provided to us by Adam at ForexAccounts.net
Edward Revy,
http://forex-strategies-revealed.com/
Copyright © Forex Strategies Revealed


There will be several trading signals even with daily charts. But you need to trade atleast 15-20 currencies pairs. Almost all people who trade daily charts trade atleast 15-20 pairs or even more.
You also need to have atleast two trading strageties or setups so that you get atleast 5-10 trading signals per month which is more than enough to make over 100% per year if you know position sizing and risk management.
Love the simplicity ... Thanks ...
thanks you for share your point
very nice i like
This strategy works very well. I made thousands of pounds over the past weeks doing this using majors and crosses. Only thing I do different is using the MACD and RSI as well to re-confirm entries. Other than that. The simpler the better and if trades dont go in your favour, hold onto them! I had -200 pips but the overbought level went even higher until it eventually all went short for a good 300 pips profit
Hello there, everyone, I lost a lot of money in trading. If anyone of you can help me and teach me some strategies and components of trading please reply me please. My facebook is
[email protected]
please help me
It is interesting to see that if the close of the candle is above the fibo's line this may mean a buy sell and viceversa, with the confirm of the ipersold or iperbuy of the Stocastich.
good
arg, fibs dont work for any purpose other than give you a general idea of how much recent gains have been given up. your theory is dumb for one simple reason. you don't need the fib lines to see the stochastic cross once price has made a retracement. no brainer.
Yes this is the most simplest form of trading, but for the indicator. Take that away, it doesn't show anything. One trader even drew a trendline in that lagging price data reader.
Entry and Exits are all based on candlestick formations. Mark out horizontal lines for S/R/ Use Fibs to but pullbacks, it is good, but it only happens 60% of the time.
Why? Because the Institutions also know how to plot them, and they are not going to give it away are they.....so be prudent, draw your TrendLines, wait for the candle signla, and target a 3:1 risk ration trade. Stops must be well above last bar's sing high/low.
Keep your charts clean and the only sguiggly lines must be made by you, not ondicators. You may use the EMA 200 to re-confirm trend, but never use it as S/R levels.
Thank You everyone, if i have said anything wrong here, i am sorry.
SanjayRam
Also check out fib expansions to plot future movement and future resistance lines (areas to take profit). On this chart fib epansion would've worked great as the market retraced to the 50% line. Future movement adhered perfectly to the fib expansion 61.8 line. Profit taking at 1.6060. Those of you doing the math at home, that's about 440 pips. Not bad for three weeks. How many are making more in intraday trading?....
Chart it and love it. Works great on daily charts! Cheers and best trading!
"Am I trading the market, or is the market trading me?"
for stop loss, i believe for say a buy for instance, a few pips below the next fib level where d retracement pullback ends, for targets, i'd go for a few pips just below the last swing high.
good strategy
Dear Adam:
Your system is great, but i dont know how to place long or short entry, stop loss and exit.
Thank you anyway for sharing your system here.
Best Regards,
John K. Phany
Post new comment