Complex trading system #8 (CCI Divergence Breakout)
Submitted by User on April 9, 2009 - 15:01.
This strategy is actually one of my favorite divergence strategies and takes little practice to expert it.
Warm Regards,
Navin Prithyani.
---------------------------------------------------------------------------
Timeframe : 15mins and above
Indicator : CCI (Commodity Channel Index)
Strategy By : Navin Prithyani www.urbanforex.com
Description : This strategy uses hidden divergence and price action to take a breakout trade. Divergence is the one key indication in the market that can be useful and is not lagging. It is a sign of a market reversal coming up in the near future. Understanding and making use of divergence will help a technical trader greatly when analyzing the market.
Note : On my CCI, I always connect my peaks (tops) never the bottoms (dips). It is critical that you watch the video tutorial below with this strategy to understand it fully.
Long Breakout
- Price must be trending downwards
- CCI must go towards the upward direction and bounce
- After a bounce on the CCI, connect your high peaks on your price
- Aggressive : At a clear close above the trend line enter long
- Conservative : After the trend line is broken, wait for a pullback to the trend line to enter
Short Breakout
- Price must be trending upwards
- CCI must go towards the downward direction and bounce
- After a bounce on the CCI, connect your dips on your price
- Aggressive : At a clear close below the trend line enter short
- Conservative : After the trend line is broken, wait for a pullback to the trend line to enter
Stops
- If your trend line is not that steep, you can keep your stops at the high/low of the breakout candle.
- If your trend line is steep, keep your stop at the swing high/low
- If your trend line is medium steep, keep your stop at the low of couple candles away
Exits
- 1:1 Risk to reward. If your stop is -12 pips your limit should be +12 pips.
- Open 2 lots. If your stop is at -10 pips, once your trades goes in your favor and you're at +10 pips, close 1 lot and let the other one run. Exit at Support and Resistance levels.
- Exit at the nearest 50 or 00 level. These are psychological levels. (make sure your exit is at least the same number of pips as your stop, otherwise dont enter the trade)
- Trailing Stop. Once in a trade, at the close of each candle, place your stop 1 pip below the low (if in a buy trade). Vise versa for sell trade.
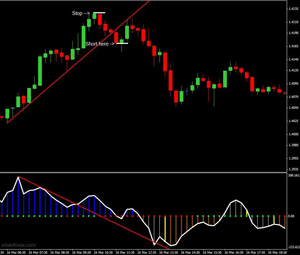
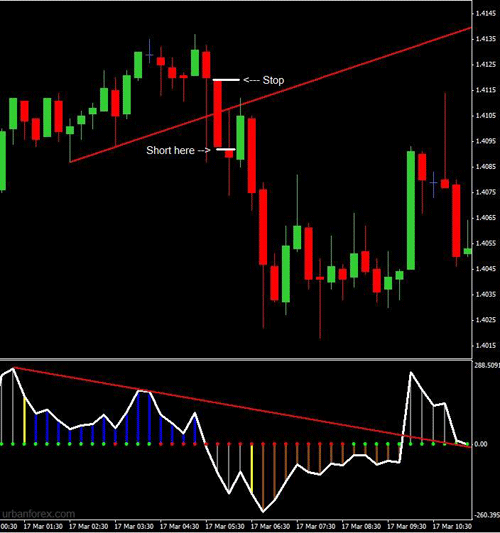
Short Example :
|
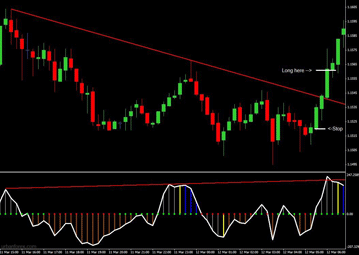
Long Example :
|
|
Video Tutorial : |
Edward Revy,
http://forex-strategies-revealed.com/
Copyright © Forex Strategies Revealed


CK.2X Says exellent performance to you.
Hi,
I'll follow a lot of people here, and thank Edward for the amazing amount of information gathered on this site.
I have been playing a very little bit with this strategy, since I've been looking for a while for a decent divergence indicator.
It might sound very basic as a question, but I was wondering the weight of CCI versus pivot lines.
Obviously, from few backtests, this strategy indeed allows for spotting divergence.
What I can not figure out is: what happens when price gets close to R/S lines? Can we expect that the price will bounce up and down around this line, or will the market finally lead to a divergence? In other words, will this strategy plot anything else than ups and downs around the R/S line? or can we expect the price to really get off these "attraction" areas?
Thanks again for your help!
i was trading using cci divergence but loosing but now with the tip of " In a down trend, we need to look and connect the low points for the price and CCI indicator to find divergence.and vice versa for uptrend thenx alot
Hi Caretaker,
Let me use the same Long entry screen shot with my remarks on it now (in Cyan):
In a down trend, we need to look and connect the low points for the price and CCI indicator to find divergence.
As you can see on the screen shot:
- price makes new lows
- while CCI is no longer supporting it.
That gives away a signal that a downtrend is about to end.
The rest is correct: you draw a trend line as shown on the chart, and enter as soon as the trend line is broken.
You decision to go Long on the breakout is supported by divergence signal received from the CCI earlier.
Best regards,
Edward
Hello Edward and others.
This strategy, or rather a combo of this with some other seems very promissing. Actually, I was astonished to backtest CCI divergence and see how well it predicts the price moves.
I tried divergence trading before but I lacked clear entry points. With the trendline breakouts it became much more clear.
Now, onto my questions:
1. I find it hard to understand the logic behind long entries as by the example picture in the initial post. While the short entry is a 'by the book' classical bearish divergence, the long entry rules boggle me a little. The setup suggests a hidden bearish divergence (an upcoming move DOWN), which occurs in the example. However, the strategy tells us to ignore that and rather go Long after the downwards move 'burns out'. So, in my understanding, it is not really a divergence trading but rather trading the move (in the opposite direction) that comes after the divergence initial move finishes. The question is: WHY?
(actually, it kinda relates to my second question and even a possible explanation for the 1st one, but I would love to know your judgement of it)
2. Why is it that we are to connect highs ONLY? The nature of forex trading suggests (afaik) that both sided view of the price behavior should be quite the same. If we take a look at the Long entry example pic in the initial post, we can actually spot a classical bearish divergence if we connect the bottoms (CCI lower low being ~15 bars before the second connected high, CCI higher low 6 bars after that high, and actually, any other low that followed).
If we followed the rules, a later price rapid move could have hit our SL, but still, the CCI low never reacheds the level of the first low mentioned. Thus, I am close to conclude that the example long entry might have been successful due to the classical bearish divergence.
I'm just not sure if I can find a reason for the Long Entry rules to work otherwise. And I am of the sort who need to understand to believe.
Any thoughts would be graetly appreciated.
A HUGE Thank you for everything... not writing more, the post is longish as it is.
Best regards
Caretaker
Hi,
I have one: cc_Divergence.mq4
Regards,
Edward
hi all..
do you have cci divergence indicator which automaticaly draw the trendline and make a alert sound??
so we just wait.. :D
or cci divergence Expert Advisor??
thanks..
Hi Fede,
it's Navin's strategy. But I think the favorite pairs would be EURUSD, EURJPY, USDJPY, AUDUSD and USDCHF.
Regards,
Edward
Hi Edward, What are your favourite pairs for this CCI Divergency?
Regards,
Fede
To download the CCI with color bars go to the comments on the first page.
CCI period used in the strategy is 14.
Hello
This is the frist time i come to your site and i would like to thank you for information.
Micael
From Portugal
I was wondering how on the cci can you get the bars wirh different colors. I can only get the line on mine. Thanks
Hi Navin,
what setting for CCI do you use or it depends on my preferences?
Thanks Michal
It's a matter of preferences imo...
why is 14 day moving average better for day trading than 20MA?
is there any other indicator we can add to cci indicator ffor better entry?
ovo
Post new comment