Complex trading system #9 (H4 Bollinger Band Breakouts)
Submitted by Edward Revy on February 10, 2008 - 18:14.
H4 Bollinger Band Breakouts
by Rpchost.com
Open the 4 hour chart and choose whatever currency you want.
Insert the Bollinger Band (20) indicator and be sure that its center line is appearing.
Identify 2 valid lower points OR 2 valid higher points in the Bollinger Band and drop a line from the first to the second line; it will be our break line.
Now when a candle closes above the break line issued from the higher points and in case the center line of the Bollinger band in the 1 hour chart crosses the break line then we have a LONG Trade.
If the candle in the 4 hours chart closes under the break line issued from the 2 lows points and in same time the center line of the Bollinger band crosses the break line in the 1 hour chart, then we are in a SHORT trade.
If the candle in the 4 hours chart closes under the break line issued from the 2 lows points and in same time the center line of the Bollinger band crosses the break line in the 1 hour chart, then we are in a SHORT trade.
I will give an example:
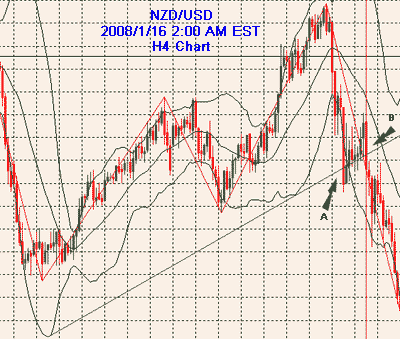
Open the 4 hours chart, open NZD/USD currency and locate the date 2008/1/16 2:00 AM EST

You can see the breakLine I dropped; it is a 2 lows points Bollinger Band which I mention it above
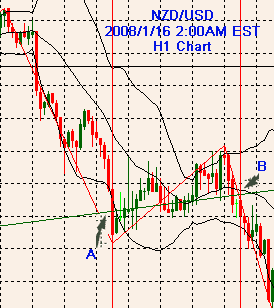
Now wait till a 4 hours candle break the BreakLine, you can see the candle (A) first breaked the Breakline, but is it a valid Sell Entry ? we must confirm it. So we open the 1 hour chart and locate the same Point (A) in the 1 hour chart.

We look at Point (A) in H1 and we locate its center Line (The Center Line of The Bollinger Band), as you remark that the center line didn't cross the Break Line as the candle A did; so it is not a valid sell entry, and as you can see the price go up again. So we wait another opportunity.
We reopen the H4 (4 hours chart) and wait till point (B) is formed, we see the H4 candle crossed the BreakLine, is it a valid sell entry ? we open the H1 chart and locate the Candle (B) , we look at the center line we see the center line crossed the breakLine so we do a short because we confirm the sell entry.
Another method: Bollinger Band Sharp Deviation Part I
Edward Revy,
http://forex-strategies-revealed.com/
Copyright © Forex Strategies Revealed


what is the settings for zig zag line
Sorry but why don't you just use the candlestick lows for the trend and enter earlier?
In simple terms - what you are looking at is a moving average and its standard deviations mapped on either side. The candle closing "above" the "breakline" and moving back to the centre line (in the long entry example) is called a mean reversion. That usually happens when an outlier is touched.The "break line" doesnt really bear any relevance other than being a trend line.
Not sure, why Bollinger Bands should have Simple of Exponential settings.
But just in case, use Simple.
If your Bands don't have the middle line, simply add 20 SMA - it'll become a middle line.
E.g. Bollinger Bands (20, 2) - use 20 SMA
Bolllinger bands (30, 2) - use 30 SMA and so forth.
Thomas
Hi
Which bollinger bands are u using,simple,exponential or what?And what if mine does not have a center line.Please advise
Al
I watched a video about this kind of strategy before but, the author said you should wait for a RSI divergence before the BB trendline break, that will ensure more confidence in the trade
I would guess, if the author offers none, everyone uses their own.
OK for the entry, but what about the exit (SL, TP, TS)?
And have you tried this method on lower timeframes (e.g. 5min and 30min)?
Thanks.
Chamane
It shouldn't be like that.
When you draw a trend line on 4h chart it should remain visible on 1h, otherwise it is a lot of trouble and no use.
Ask for an advise from your Forex broker. There must be a way to see the line crosscharts.
Thomas
Hi Joe,
Thanks for posting your system. I was hoping you could help me. I draw a line on the 4h chart but then I go to the 1h chart and the line doesn't appear. Do I need to draw the line on the 1h chart as well, and if so, how do I make sure the line is corresponding the same low or high points as the 4h chart?
Thanks Joe
I am sorry joe, as i am newbie i would prefer a chart , can u please draw a chart and explain like our Edward does every time
Hi Joe,
Thanks a lot for your great efforts in re-explaining the strategy.
I understood the strategy the same way and based on my understanding I can confirm that you've nailed it.
Thank you!
Best regards,
Edward
OK, so this strategy intrigued me, but I couldn't make heads or tails out of it, and it seems as if others here were likewise confused. I followed Joe's link and I think I understand the strategy. For my own edification, I re-wrote it for my records in a way that I could follow it. With apologies to Joe if I got anything wrong, I submit what I wrote up here.
Joe, if you're still checking in, please correct me if I got anything wrong.
I have not tested this strategy at all, only sharing what I think is a more understandble explanation of the strategy:
_________________________________________________________
Open the 4 hour chart of any currency.
Insert the Bollinger Band (20) indicator and be sure that its center line is visible. We’ll need the center line on the 1 Hour chart later.
Identify the 2 points of your lower Bollinger Band that enables you to draw a line such that the line touches your BBs only on these two points. If no such line exists, we do not draw a line on this chart. If one exists, extend it forward. It is referred to as our SELL break line.
Alternatively, identify the 2 points of your upper band that enables you to draw a line such that the line only touches your BBs on these two points. Again, if no such line exists, we don’t draw the line. Extend it forward, and this is our BUY break line.
If you have a BUY break line: When a candle in the 4 Hours chart closes above the break line, open a 1 Hour chart. We do this because it will confirm a valid trade. The 1 Hour chart will have our break line on it, and we now see the Bollinger Bands determined by the 1 hour bars or candles. If the center line of the Bollinger band on the 1 hour chart has crossed the break line recently, then we trade LONG. Crossing the Break Line recently is a confirmation even if there has been a slight retracement and the center line is currently below the Break Line, as long as it is fairly close to the line and curving upward.
If you have a SELL break line: When a candle in the 4 hours chart closes below the break line and the center line of the 1 Hour Bollinger band has recently crossed the break line, then we trade SHORT. Again, crossing the Break Line recently is a confirmation even if there has been a slight retracement and the center line is currently above the Break Line, as long as it is fairly close to the line and directed downward.
I hope I got that right, and I hope it helps.
Joe (T)
i'm sorry this is nonsense.please put up a chart and re-explain.
Hi Edward,
Highly appreciated and Thank you very much for this website existed.
Landori
Malaysia.
Post new comment