Exit strategy #9 (Keep every pip)
Submitted by Edward Revy on September 25, 2010 - 19:41.
This is an exit method for those who hate "losing those pips" which come with a great market move and then vanish immediately (or shortly after) on a reverse.
When the price shoots (up or down), it creates an out of the range tall candlestick.
Many traders know about this fact, but the main challenge is that when you look at the charts how do you tell when the candle is tall enough and when not.
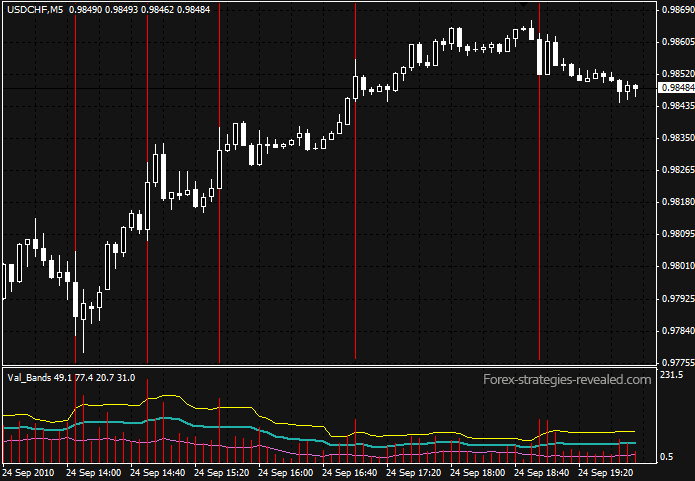
The solution came with this interesting indicator that combines similar to Bollinger bands algorithm and Candle Length Volatility.
Download: Val_Bands.mq4

Red histogram: the length of the candle in pips.
Bands: the average of the candle length with standard deviation.
- Yellow band: reading above it suggests that a candle is taller than usual, and it's the time to Take profit. (Also, don't open any new trades there).
- Blue band: reading close to it - an active trend.
- Pink band: reading below it - ranging market. (Crossing the pink line from below - beginning of a trend).
You can use this indicator for exits/TPs on any time frame for any type of trading: from scalping on 1-5 min to position trading on 1-4 hour or daily charts.
The width (deviation) of the bands can be changed to improve sensitivity of the indicator.
Other notes:
1. It is also interesting to look at this indicator in combination with Volume.
2. Another idea would be to combine it with Divergence trading to identify market reversals.
Edward Revy,
http://forex-strategies-revealed.com/
Copyright © Forex Strategies Revealed


Hi Edward
I don't understand the way MQ4 works, although, I'm pretty handy with C++. I'm trying to understand the logic of the code so I can code it for my trading platform.
Correct me if I'm wrong:
Basically, we divide bar range by point (Val_BarsBuffer), then calculate a simple moving average of Val_BarsBuffer (MovingBuffer).
Then subtract the MovingBuffer from Val_BarsBuffer and you get newres. For each bar, you add the square of newres. You then work out deviation (pretty straightforward) and the upper and lower buffers (pretty straightforward).
With regards to the other variables, k, i, etc...I'm not sure what those measure.
hello,
thank you Edward, that's a great exit strategy for intraday trading.
I was wondering if someone know where can i find a trailing stop EA with this strategy?
or if a programmer is wiiling to do it, it would be highly appreciated ;)
thanks
Hi Edward, do you know where I can read more about this indicator? Is Val Band the name of the indicator? Cant find much info about it.
Mo
hi edward
kindly give the formula of val bands for metastock and how much we zoom the chart for best result because by zooming the chart the results are different
regards
parag
cool one
Thanks
Make sure that you always place all indicators into "/Experts/Indicators" folder,
while EAs into "/Experts" folder.
That's the only requirement. If it doesn't work, try it on demo with another broker.
Kind regards,
Edward
see the first page - link just above the screenshot..
The stratagy seems cool, but were can i get this val band from? i use mt4
sorry, I don't have a strategy so far to combine it with the volume indicator.
Kind regards,
Edward
thanks for that wonderful ind
but plz i would like to know how to use it with volume?!!! cause iam working on a system using 5SMA based on volume and Volitaly system
so plz explain how u use it with volume
thx
w.m
how can i use it with volume?
because iam trying to make a system out of 5sma based on volume & voliatily system indicator
any help is appreciated
w.m
Thank you for your promptness, I managed
Just checked, it works. Leave me an email and I'll send you the file.
Regards,
Edward
Post new comment