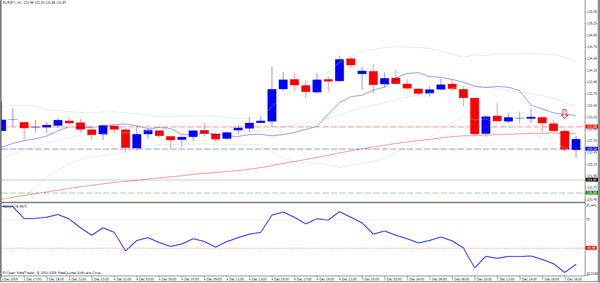
Forex trading strategy #41 (RSI, Bollinger & 75EMA)
Submitted by User on January 9, 2010 - 14:30.
H1
RSI 14, 75ema, BB 20, 5ema shift 5
GOING LONG: When a candle closes above the 75 ema as well as the bollinger middle line, and the RSI line breaks above the 50 line or a resistance pattern, enter LONG.
Stop loss - there will be 3 notable levels below your entry - the low of the signal candle, the 75 ema, and the recent swing low of the 5 ema. Of these three I will use whichever is in the middle of the others to place my stop 2 pips below.
GOING SHORT: When a candle closes below the 75 ema as well as the bollinger middle line, and the RSI line breaks below the 50 line or a support pattern, enter SHORT.
Stop loss - same as for long - I will place my stop 2 pips + the spread above whichever is the middle of the 75ema, high of the signal candle, and swing high of the 5ema.
I will either use a 1:1 R:R, or a 1:2, so either close my trade at 100% the distance of my stop or 200%, depending on how wide the stop is to begin with - for example if my stop ends up only being 45 pips on GBPJPY and the trade was opened near the beginning of London, I will use a target of 90 pips. But if my stop is 78 pips on EURUSD, I will use a take profit of 78 pips as well.
I generally risk 2% of my total account for this particular strategy.
On the picture, the red arrow is pointing down to the candle that generates the signal, and the position is taken when that candle closes. The blue line indicates the entry price for the short, the red line indicates the stop and the green line indicates the target.
Edward Revy,
http://forex-strategies-revealed.com/
Copyright © Forex Strategies Revealed


Hi
what is the difference between using BB20 and SMA 20?
What is the purpose of Ema 5?
what is the purpouse of ema 5.i think you dont mention about EMA 5
RSI has already been under the 50 line for a while, so it is not a valid entry; however, if you you look on some candles further you could see a 50 line RSI break upside and a candle closes above the BB middle line. Instead of shorting, you should take the long signal here.
Zseron
Don't think this is a rewarding strategy.. or I must be doing something wrong. Take a look at this picture. Going back looking at the EURUSD 1H chart, it's full with examples like these.. Is it just me?
RSI 14,
Bollinger Bands 20.
Regards,
Edward
what is setting for bolinger band and rsi
plz email me at hnyzah()hotmail.com
thanks for all
In MT4 when you call to insert a Moving average, (or you can also right click on the current MA on your charts and go to Properties) it offers you a settings window:
There, if you want EMA - change MA method to Exponential,
SMA - Simple, WMA - Weighted.
I'm not sure what's about MACD, try this one for a change:
Good_Macd.mq4
cheers,
Thomas
In MT4 where to get EMA n SMA..I noticed only moving average..
In my MACD im getting only two indicators, a cross hair and an average line, only two color options are there in properties, how to display one more average line..
Thanks..
superppppppppppppppppppppppppppppppp
Hi James,
don't worry, your strategies are coming next.
Best regards,
Edward
Hello Edward, I posted several strategies and u did post online. Please why? James (bondfx)
Post new comment