forex trading strategy #29 (RSI & Regression line)
Submitted by User on January 14, 2010 - 14:30.
Strategy by Mennzz
Currency: ANY
Time frame: Daily
Indicators: Regression(14), RSI(7)
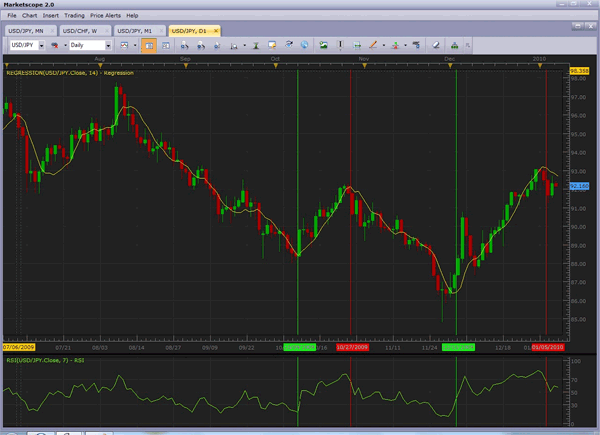
Details in the photo below.
Only take a buy trade when the RSI(7) crosses the 30 line, and the candlesticks cross the Regression(14) line. and the opposite to sell. The Daily chart works best with this layout, and yes, I did take successful trades with this layout.
Not necessarily does the RSI have to cross the 70 or 30 lines to have a good trade, but for the best trades, you should only wait till the RSI crosses.
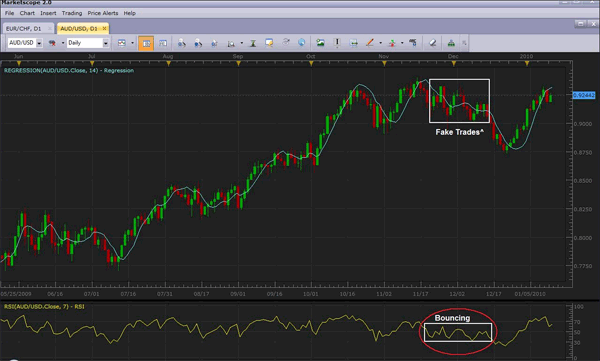
To tell you the truth, these currencies [USD-JPY - AUD-USD] work best with this layout, although you can use other currencies, and the RSI line sometimes bounces between the 50 line instead of crossing the 30 or 70, which can lead to losses if traded (Example in pic below).
(I should be coming out with 1 more strategy soon!)
Enjoy.
-Mennzz
Happy Trading!
Edward Revy,
http://forex-strategies-revealed.com/
Copyright © Forex Strategies Revealed


Good article, I have tested a reversion to the mean trading strategy and I cannot find an edge in it: reversion to the mean.
With RSI signal you'd be entering with the opening of the next candle.
I was trying this system alongside with my older one. It wasn't bad =)
Thomas
Hi Azim,
When the RSI crosses either lines, you should wait until the bar closes, because, sometimes the the RSI line doesn't cross the buy or sell lines. Thats why you should always wait until you know for sure that it crossed the line.
Regarding the next strategy, you can visit: http://strtrading.blogspot.com . It's called "New! - Powerful Simple Trading Strategy II". This blog is dedicated to my next strategy's. The strategy I have on my blog will be posted soon.
I didn't use this method for long, and yes, I was on a live account. Currently, I'm using the "New! - Powerful Simple Trading Strategy II" on my blog.
Regards
-Mennzz
sorry i think it was a mistake, i thought you're the author of this strategy..Im sorry, i mean Mennzz
Im looking forward for your next strategy,any idea when will it be?=D
and Thomas,
When the RSI crosses the line(buy or sell)should i enter it right away?or enter the trade at the opening of the next candle?
regards,
Azim
Okay Thomas i'll be looking to try out your strategy in 1 hour.i also use market scope besides mt4..
by the way, you're on live account?and how long do you use this method?sorry for too many question asked cause i am very excited to know some one who uses fxcm too=D
Azim
USD/JPY & AUD/USD and I'd add USD/CAD would do the fine stuff.
As for the time frame, I think RSI would give a lot of weak signals on 15 min, so probably 1 hour is the lowest I'd try.
Thomas
Hai All,
What currency do u guys recommend for this system and can this be applied to TF 15 mins or lower?
Azim
Thank you, Edward, for sharing the regression line indicator for the Metatrader.
Hi, how long have you traded this method and did you do any backtesting before hand?thanks
Hi - looks interesting for sure.
Can you tell me why you only recommend the 2 pairs? Is it that they have proved most profitable in backtesting? Or are they just your preferred pairs?
I think it would be helpful if you could post details of any backtesting you have done!
Might I suggest an initial stop above/below the hi/lo of the bar you enter on and a trailing stop 5-10 pips below the lo/above the hi of the proceeding day - assuming that day makes a new hi/lo?
Be interested to hear your thoughts.
Many thanks,
Rob
Hi Mennzz,
Thank you for sharing this strategy!
I've got one Regression line indicator for MT4, hopefully the right one:
Linear_Regression_line.mq4
At least appears to be matching closely the very first USDJPY chart above.
My MT4 screen shot:
Best regards,
Edward
Hi,
A Regression line is not an EMA or SMA. A Regression line tells you if the trend is going up or down. You have to wait until the bars cross(Close) the regression line and RSI line crosses the 30 or 70 line at the same time. Then exit when the RSI touches the 50 line. But, if the RSI continues going past the 50 line, then get back into the trade, and continue on.
I don't have a Regression line for MT4 Platform. But, someone on this forum can make or give you this indicator.
Note: I should be coming out with another trading strategy with EMA and something else...(Coming Soon).
Enjoy!
-Mennzz
Happy Trading
Hi nice simple strategy, just wondered how you work out entrys SL & TP? also do you wait for a candle to open the other side of the regression? does it have to be exactly where the RSI crosses over?
thanks
Post new comment