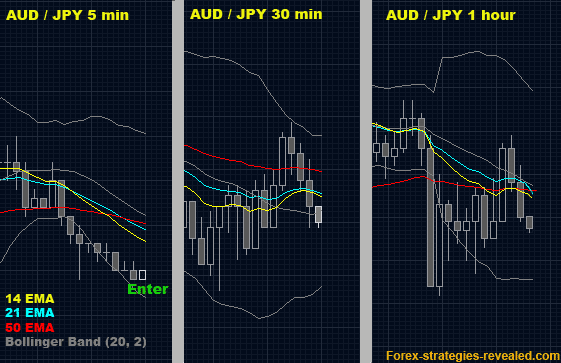
Complex trading system #1 ("Multi-conditional")
Submitted by Edward Revy on April 19, 2007 - 16:48.
Currency: ANY
Time frame: 1 hour + 30 min + 5 min.
Indicators: 14 EMA, 21 EMA, 50 EMA, Bollinger Band (20, 2).
Entry rules: Enter on 5 minutes chart.
On 5 minutes chart, for uptrend:
if 14 EMA is above 21 EMA,
then if both 14 EMA and 21 EMA are above 50 EMA,
then if 50 EMA is within the Bollinger Bands borders,
then...
go and check 30 min chart:
if price bar is a up-close bar and sitting on 14 EMA or 21 EMA
and same again:
if 14 EMA is above 21 EMA,
then if both 14 EMA and 21 EMA are above 50 EMA,
then if 50 EMA is within the Bollinger Bands borders,
then...
go Long...
OR go and check if 1 hour chart meet same conditions as for 30 min chart and then go Long.
If at least one condition is violated – stay away.
The reverse is for the downtrend:
Enter on 5 minutes chart.
On 5 minutes chart, for downtrend:
if 14 EMA is below 21 EMA,
then if both 14 EMA and 21 EMA are below 50 EMA,
then if 50 EMA is within the Bollinger Bands borders,
then...
go and check 30 min chart:
if price bar is a down-close bar and touching 14 EMA or 21 EMA
and same again:
if 14 EMA is below 21 EMA,
then if both 14 EMA and 21 EMA are below 50 EMA,
then if 50 EMA is within the Bollinger Bands borders,
then...
go Short... or go and check same rules for 1 hour chart and only then enter Short on 5 minutes chart.
Exit rules: exit when any of the conditions is violated or when the profit is high enough to close the trade.

Edward Revy,
http://forex-strategies-revealed.com/
Copyright © Forex Strategies Revealed


The system works charmly. And as the guys above is correct, you need to check higher timeframe first. Check 1 hour, then 30 min and last 5 min.
I target only 3 pips as TP and 20% daily.
Normally when trading with different time frames, the biggest time frame is the first to observe, then lower time frames should be checked to get a good entry point. For me, this method makes no sense as it is presented!
But, what do I know!!
and thanks for the multitimeframe strategy, i like multi time frame strategies especially when i create it into an ea, and Edward what are the variation in results if we ignore bollinger bands and what tp and sl do you suggest for this strategy
i'll try to code this strategy into an ea (y)
Yes, DSV
I see no problems with using higher time frames combination for this strategy.
Especially if you're able to code it, you've got to try out all possible combinations.
Best regards,
Edward
Hello Edward,
I've been following this site for quite a few days now in search for great strategies I can code up myself for automatic trading. This strategy sounds very promising and I'm now wondering if a strategy like this can also be used on longer time frame combination. e.g. 1H + 4H + 1Day.
Thanks for sharing your great work,
DSV
Hi
Eish man am lost on yo strategy.I mean on yo 5 min chart where you indicated enter do you enter long coz you seem to indicate a long candle on a downtrend.And one more thing do i have to wait for the bars to sit on the moving averages(like on your charts) or they just have to be above the averages.
Confusd me
I'm a great proponent of multiple time frame analysis and I prefere to involves the pivotal points. Sometimes it will make much more sense if all indicators shows an entry when the market price is far off the next pivotal point and/or a divergence shows aligned probabilities of the same a possible direction. Then I prefere to go in the market if all indictors will show me he green ample to go.
Nice work!:-)
Yes, it could be simplified that way.
Best regards,
Edward
Can I simplify your method? All the charts (5,15,1h) have to give same signals either buy or sell. Am I right?
Hi Tommy,
Do you have a performance report for any parity you can share with this foro?
We would appreciate it very much.
Armando
Ahhh, sorry, now I get it.
there is no up-close bar on 30 and 1 hour chart.
On the shot above there is only one condition met - for 5 min chart. For the rest, it's not been met yet.
And so if that is to be here and now one needs to wait for a "go" signal from higher TF charts.
Hi Tommy,
I understand your written system, but its not identical with the 30 min and 1 hour chart. The 5 min chart shows a long situation identical with trading system. But now change in the 30 min chart(also 1 hour), i don't see a current up-close bar which sitting or touching the EMA 14 or 21. Current I see only a down-close bar under!!! the EMA's. Where is the necessary up-close bar for this long trade?
Steffen
Hi Jatin,
Up-close bar is a bar with Close price higher than bar's Open price.
Down-close bar is an opposite: it opens at higher price, but closes at lower price.
Up-close bar is often seen as a gren colored bar on many trading platforms, it is also called a bullish bar.
Down-close bar is colored in red and called a bearish bar.
Tommy
hi u dd great jod but what do yu mean by 'if price bar is a up-close bar and sitting on 14 EMA or 21 EMA' i nt understand that.
And in the chart here it is a short condition?
thanx,
jatin
Post new comment