


#3 Range-bound trading (34 EMA + 5 EMA)
Submitted by Edward Revy on December 17, 2009 - 17:56.
Many systems start with words: "I’ve been observing charts for a while, and suddenly an idea popped up in my head". Same was with this one for me. I’ve been looking at charts, in particular at moving averages, and came up with a trading plan to foresee upcoming ranging markets.
This is the earliest detection of a ranging market known to me, and I’d like to share it with you today.
Trading rules:
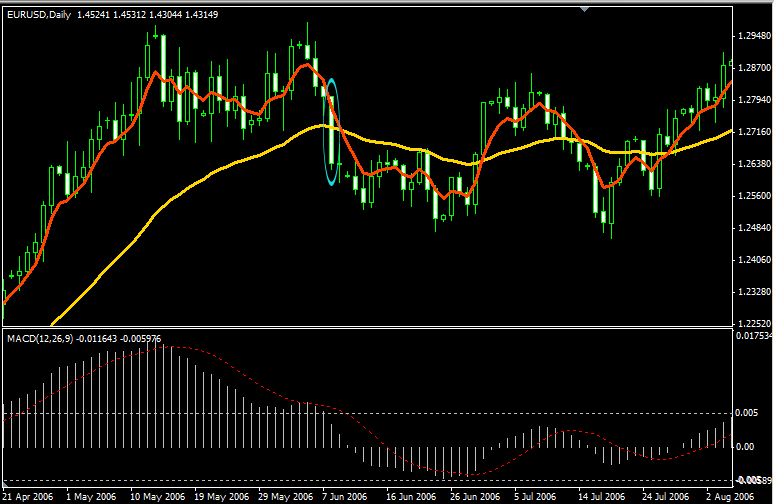
On any time frame we need two Moving averages: 34 EMA and 5 EMA.
After both moving averages have been trading apart for a while = the market was trending, start watching for the first candlestick to touch both moving averages (body + shadows, everything counts). Here is our first candidate on the screen shot below:
This is the first earliest sign that a sideways pattern might be forming. I used words "might be" because we don’t know what’s in for us ahead. But let's go step by step. Below is what you’ll be actually seeing in real time:
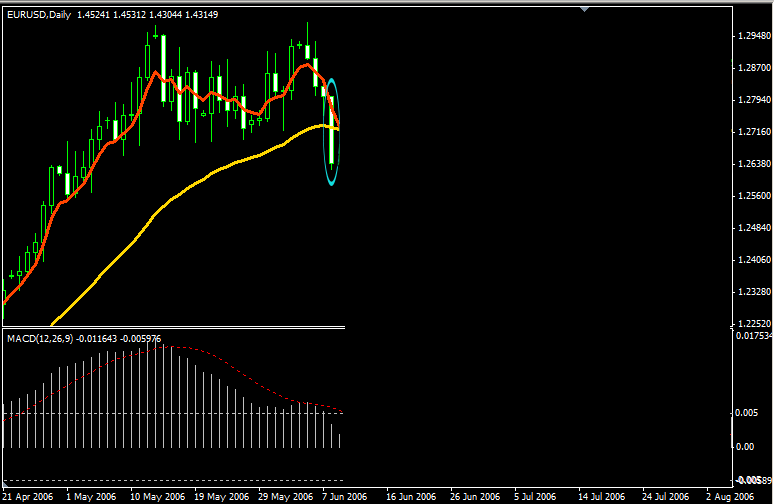
Our next step is to look behind that candlestick and identify the closest swing high and low. Both those swings should be outside the reference candle body length, including shadows. Reference candle is the one I’ve circled in blue.
Once we've found both swings, draw horizontal lines thought them as shown on the screen shot below:
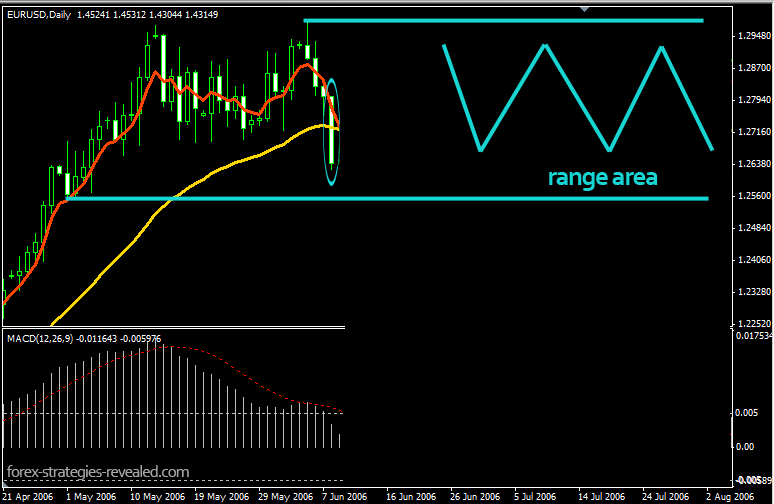
That’s your anticipated range area ahead. As long as price stays inside that area, you can treat it as a range-bound move.
Let’s now have a look what were the actual results:
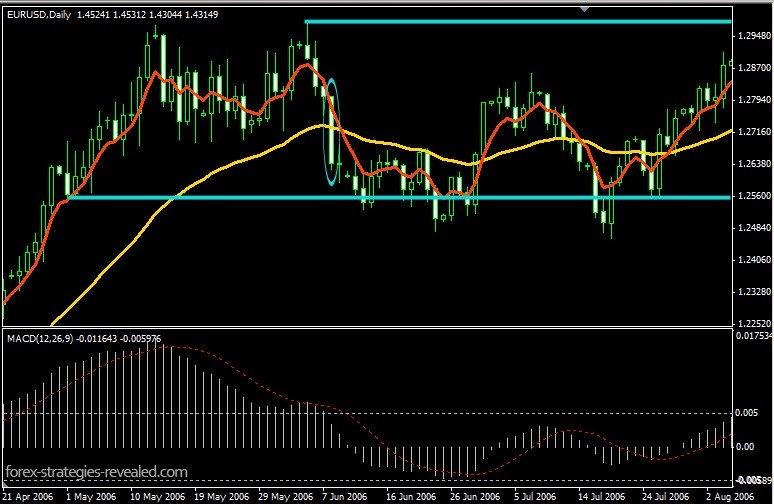
Price holds inside the predicted range! Pretty good forecast, isn’t it?
(By the way I left MACD on the charts just for the reference to the method I’ve described earlier in range-bound trading #2)
But that’s not all. We can go further and each time a new candle touches both Moving averages, we are free to reset our range boundaries to new highs and lows using the same old rules. Range boundaries can go up and down during each new re-set, it is fine.
You can now trade breakouts out of those ranges, or wait till there is a new trend to be traded.
When re-setting, keep the boundaries of the very first range for the reference, when price finally breaks that level – that’s a significant achievement, and a new chapter for a new trend.
Edward Revy,
http://forex-strategies-revealed.com/
Copyright © Forex Strategies Revealed


Another "breaking" strategy revealed ~
The first MA crossover can also be taken as a bearish signal...
IMHO, the first MA crossover should not be taken as an indication of a ranging market. I would have waited for the second MA crossover (after June 6th). This dramatically increases the probability that market is ranging since the second MA crossover happened after only a few time periods after the first one.
This is exactly what I have been searching for, thank you so much for this! Happy Happy
So simple yet so brilliant.
Hello Sunny,
Thank you for your feedback!
I don't, however, send any trading signals, and I never offered these
services before. I share strategies and help traders by answering
their questions.
Happy trading!
Edward
Dear Mr. revy ,
i am thankful about yr articles. i think they might take my fear of keeping positions in trading markets once i suspect the range bound according ye 34/5 ema article.
please send me yr email adress : i want to follow you in tweeter or to buy yr recommendations .
my email:
light_sunny()hotmail.com
Hi Celestine,
sorry, but which one is "the very system by Jose"?
Kind regards,
Edward
when you trade with a large time frame, you can use a smaller time frame, but only for precision entries and adding to a position. When it comes to exits, you should focus on your large time frame and disregard exit signals from smaller time frames.
Hi Edward,
The extract above is the reply given by you to J. Please,the precision entries you stated there,can it mean using the very system by Jose?
God richly bless you for the good work you have been doing in this forum.
Regards,
Celestine
You could use an Awesome Oscillator instead of MACD too...
Hi guys,
We can choose a stop equal to the width of the range. That's advised if you look at the theory of trading the range breakouts, but those stops could be quite wide at times, so I wouldn't say that this is the best option.
I usually set a stop based on my own expectations and also depending on how volatile a pair is during the day. So at the moment I haven't made any rules for it.
Upon 5 crossing 34 EMA we do expect some market turns - but it could be anything: a retracement, a reversal or a range. Either way, what we know for sure is that the trend will be paused for some time.
Regards,
Edward
Hi Edward,
I am Alex. Thank you for providing a direction to trade range bound times.
Just a quick question. Doesn't it signals a possible change in trend direction when 5 EMA cross over 34 EMA?
Any suggestions re size of stop loss if we choose to "trade breakouts out of those ranges"?
Hi J,
when you trade with a large time frame, you can use a smaller time frame, but only for precision entries and adding to a position. When it comes to exits, you should focus on your large time frame and disregard exit signals from smaller time frames.
Best regards,
Edward
Hi Edward,
When drilling down through timeframes for entry/exits the range bound signals often change. Do we disregard these for smaller timeframes if our trading system in designed for a larger timeframe and we are merely using the small timeframes for entry/exits?
Cheers
J
Thank you, Keith
While in the range, we use our defined range boundaries to enter and exit trades.
We can also use Bollinger bands, where we can confidently trade the bounce of the BB lines. There is a well known strategy by J.Ross, which can be downloaded at our forum: Gimme bar system by J.Ross
Also we can add RSI on top, and take only those trades where RSI (3) has reached oversold/overbought levels. Since we know that the market is in the range (till it breaks out), RSI will allow to catch a momentum. Same trick can be done with Wiliams R% indicator or Stochastic.
A breakout is valid when it surpassed our range boundaries, namely a new candle not just pokes, but closes outside the boundaries. Then withing few next candles we expect a re-test of the breakout level, if it holds (=market closes outside the range again) then we can plan our trades with the trend.
This strategy can help visualising the idea of trading valid breakouts and avoiding whipsaws: Trading Breakouts of the Breakouts
Best regards,
Edward
Best regards,
Edward
Hi Edward
Hope you and family have a very happy new year
Thanks for sharing this trick to predict ranging market. Just have some questions:
1. What proper strategies you recommend in such condition?
2. How to determine when the ranging period ends and true breakout occurs ( by using RSI, MACD, bar close above/below MAs, etc....)?
I think if we are able to spot ranging market then we can take advantage of it.
Thank you,
Regards,
Keith.
Post new comment