#15 Swing trading with VMA's
Submitted by User on April 29, 2011 - 09:44.
Submitted by Grant Chappell
I have been using Walter’s system (scalping system #6-a) for some time now, practicing, modifying updating and trading. One change I made was cut out many lines until only 4 were left, being the 1, 4, 26 and 100. On the 5M chart it took too long to update with all the VMAs being calculated.
I found that I had a few fundamental problems with his scalping system, i.e., I am not a good scalper.
· I am too slow
· Can’t wait for signal
· Anticipate a turn that doesn’t come
· Not taking profits and getting stopped out
· Getting too excited
· Going against the larger trend and not knowing it.
So what I did was make an EA to study alternate time frames.
Found 4H was best.
Less sensitive to timing than 5m
Less pressure/ quick-thinking needed
Less time in front of computer
Set it and go.
Time frame: 4H
Currency pair: my fave is EUR but any trending types are good, GBP, AUS, NZ, CHF
Trading setup: VMA 1, 4, 26 and 100.
I have the chimp 2.1 oscillator on the chart to look at divergences mainly. To setup the parameter on the VMA, I changed the ADX length to 8, and the the MA length is 1, 4, 26, 100. The changed ADX smooths it out a bit. Use your fave colors. Remember this is all MT4.
Downloads: chimp2_1.mq4
FantailVMA3.mq4
scalper.zip (template)
Trading rules: If the VMA 1 is above the VMA 4, go long.
Reverse for opposite. It’s that simple??? I look at the 26 for a few things, one what is the mid term trend and also retracements, it sometimes hits the 26 and continues, this is an Icon according to Walter I think.
Protective stop is placed at the moment of entry and based on ATR (20). It is more or less 50 pts.
Profits: This is a trend following system so we need to let them run. Originally I just let the reverse cross cut me out, but I have found that in a smaller swing, this can lead to a loss even when you were up over 100 pts, so I have used Van Tharp’s idea of trailing a stop with 3X ATR which is more or less 150pts.
Can it be that simple? Well, maybe. The VMA is different from a regular SMA or EMA
in that they have a variable of ADX worked into them. ADX measures the strength of trend, so
basically we have a moving average that will move when prices are trending and when things are consolidating, not move, even go flat. This helps with the major problem of MA’s,
that being it’s whipsaw nature. The 1 and 4 can go flat with equal values with out crossing. This will keep one in a trade (no exit signals) and out of a bunch of losers (no entry signals) if the prices enter congestion.
Some notes:
Always
trade from the line. If it has
moved away from the line, it will fill that gap 90% of the time.
This
is a trend following system, so expect some drawdown when it is not
trending strongly.
To
help me get out near the top, I use a trailing stop of 150 pts which is
roughly 3x ATR(20) of the 4H. Sometimes I find that after it goes up, it
crashes and if you wait for the reverse cross, you can lose a lot of pts.
What
happens when the cross is when you are sleeping, working, etc? You can wait for a retrace to
the Dark Green 26, or look at the highest high, subtract 150 pts from that and make
this value your stop loss. This is
equivalent to being in at the start.
Adjust your position size to reflect your larger stop, and the increased
risk in not starting out at the start of the swing.
Another
entry is the flat line breakout.
Many times the line will be flat and equal and then it will drop
(rise) like crazy and leave the lines.
Many times the price will retrace and stop you out. I set up a breakout of the highest high
and lowest low in addition to the cross and take what comes first.
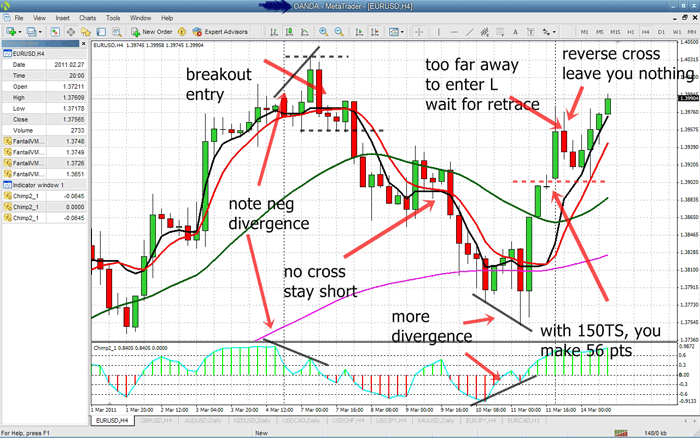
If you
look at the pic, you will note that we shorted on the breakout, had 210
pts in the bank, and then had it retrace/cross up giving us 56pts if using
a150pt TS, or nothing if using reverse cross as an exit strategy. I am looking at the viability of phasing out of positions at 100pts or so. In
other words two profit targets, one at 100pts, the other a trailing stop.
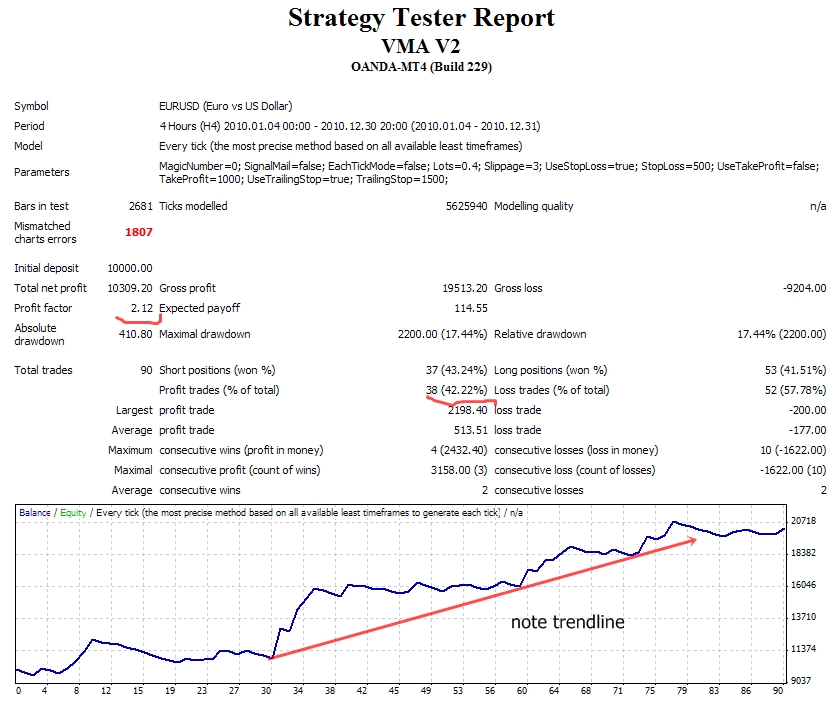
Below is the screen shot of a 1yr running of an EA I built to test for system viability.

Grant Chappell
Edward Revy,
http://forex-strategies-revealed.com/
Copyright © Forex Strategies Revealed


I loaded all Downloads: chimp2_1.mq4, FantailVMA3.mq4, scalper.zip and installed them. My chart shows 1 every thing except the vma 1,2,26,100 lines. I only see 1 Yellow line.
Love this method Grant. I apply it to range bar charts and added a SMA of 3 shifted by 3 for added confirmation. Works well for scalping whenever I'm at my computer.
Any chance you can post your EA so I can play around with settings to check long term results?
Ah, OK. I thought I saw that you'd done an EA so assumed you could add that code if not already and I didn't download your attachments.
Thanks for the follow up. Looks like a good, well thought out strategy. I'll certainly be inputing to this thread if I can add any value, but I'm more from the coding angle.
As an aside, it would be good if the filter could stand up to testing, in which case I could post an indicator just for that filter if that would be of use. Although I suspect you fx experts (certainly compared to me!) will have enough on your charts.
To user:
If you look at the first pic, a divergence is when an oscillator is making higher lows and the price is making lower lows or vv. The left divergence shows a tendency to go short, the second one to go long. Basically the direction of the oscillator will give you the new direction of the trend. The first divergence pointed down on the osc and later the prices trended lower. You must be careful as it is a leading indicator and you have no idea when the trend will change, as it may take some time and continue in the same direction for more pts than your stop loss. Ask me how I know!
A good PDF for divergence is to google “Trend Determination. Divergence by John Hayden”. He works with RSI but all oscillators are similar.
Like I said with the VMA, it has a tendency to not cross when things are sideways, if you look at the second pic, you will see that at the top it has gone flat and the values of the red and black are the same. Normally with an EMA 1 and 4, it will be crossing at almost every few candles. What the non-cross means is there is no exit signal if you are currently in a trade and no entry signal if you are not in a trade. Whipsaws are the bane of MA’s, this lessens them.
If you take a look at Walter’s system that was linked at the top, you will see that he talks about momentum and the rainbow contracting and expanding. This may be easier for you to see, but I have been using this for so long that I may have internalized it. One thing I do know, is that when the 4 lines converge, hold tight!!! It cannot contract any more so must expand, and usually with force!
There are many subtleties to any system, even if it is a relatively simple MA cross, so I cannot stress the importance of screen time. This system is basically a 1 and 4 cross. If you miss the cross, you can get in on a flat time by either going with the trend or by using a breakout entry.
Does this help?? What I suggest is to put this template to the 1M chart and watch things move. It does not repaint which is nice. Just watch the candles form, the lines move, the chimp oscillate. Screen time is what I suggest. Perhaps you can come up with some characteristics that I haven’t seen!
Thanks for your comments.
Grant
To Dai’s comment, I am sure your trending indicator would work. My problem with MT4 is that I am no programmer. I chose to make my system visually simple and to this end, I found that a trend following system that relied on moving averages was best for me. If the smaller MA is above the larger MA, the trend was up and vice versa. I use the VMA to cut down on the whipsaws that are inherent with MA’s but other than that, it is no different than the system one first learns about in Forex 101, the moving average cross.
The idea that when ATR is bigger than St Dev denotes a trend is valid; it is the big ‘decision’ candles that we want. We are looking at the same thing. What we do not know is how big is the trend. My indicators are the trailing type and so are yours. To this end I have devised a ‘have your cake and eat it too,’ split profit target of 100 pts for half and a trail stop of 3 times the ATR(20) which is more or less 150 pts. The 100pts takes profits in case the trend is not strong and the trailing stop for the big moves.
Just as I have done with Walter’s original system upon this is based, you are free to modify it as you like.
Thanks for the comment,
Grant
pls i would be grateful if someone explains this strategy in details.how we use divergence rule here and is tht VMA is raliable then emas.
I got the below from this (extremely professionally run) site, to determine whether the market is trending or not. I'm not sure how generically this could be applied and will likely parameterise the 14. But as far as I understand it, if the ATR is above the Standard Deviation then it's NOT a trending market.
Hope for more comments on this.
//check for range bound Market
if (iATR(NULL,0,14,CheckFromThisPoint) > iStdDev(NULL,0,14,0,MODE_EMA,PRICE_CLOSE,CheckFromThisPoint))
{
return(0);
}
Cheers, Dai(jobudesune)
Post new comment