#3 The Best of EMA Crosses on S/R
Submitted by Edward Revy on June 5, 2008 - 07:03.
AUTHOR: Ayetemimowa James
STRATEGY: The Best of EMA Crosses on S/R
Time frames: 1hr and 15min
Indicators: 5ema(close-red), 6ema(Open-blue), 20ema(close green), Daily, weekly, monthly pivot,Fibonacci retracement Weekly and Daily support and resistants, Breakout-Eagle Indicator.
PAIRS: Anything traded online that respects technicals - Commodities, FOREX, INDEXES, SHARES ETC
SETUP:
I will be using EUR/USD June 3 as an example.
Open the 1hr chart
plot the 5ema(close-red),6ema(open-blue), 20ema(close), add the ema_crosses indicator activating alert, plot the resistant and support lines using ur weekly and daily time frame, plot other S/R like pivots and fibo retracments of daily, weekly and even monthly. add the breakout_eagle indicator let ur parameter cover the first 8hours candles of the day in the 1hrs timeframe.
Plot all the indicators in another window of 15min time frame.
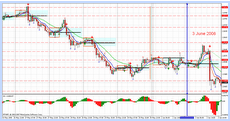
1 HOUR TF (Click for detailed image)
|
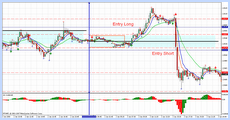
15 MIN TF (Click for detailed image)
|
ENTRY:
I have read a lot of research work on ema crosses and i have seen alot of setups that are not practical at all. but what i will give hear seems to be very easy, sure, and poise more confidence even for newbies to apply.
Wait for the 5ema to cross 6ema in the 15min time frame. An alarm will sound and an arrow will show you the direction. When you see the arrow, this is what you should do. In the 15min time frame draw a vertical line for visual aid and change the time frame to 1hour.
For you to enter a trade for short for example. If the arrow in 15min is pointing down, as you change to 1hr tf, the 5ema/6ema must be crossing and very obvious, then move back to 15min and make an entry few pips below the candle with the arrow. DO NOT PLACE A TRADE IF THE 5EMA/6EMA ARE NOT CROSSING.
EXIT:
This is very vital. You dont need for opposite ema cross before you checkout/exit, this many not be funny sometime like more people believe. Your next exit should be the next support or resistant line.
I have attached my weekly and daily template for MT4 support and resistant lines. Additionally you can add pivots of daily, weekly and fibonacci retracement of weekly, daily and or 4hrs swing highs and low
You need all the S/R lines above. Why? Online trading is a big challenge and with lots of drama, as price setout in a direction it has a destination which is a support or resistant point. So if you rely on a point, you may regret because another vital point may be a barrier to meeting your assumed point.
The knowledge of daily range can also help you in planning your entry and exit.
I hope you have a happy trading.
I will also welcome comments.
I believe you can enjoy this cos i gave to my newest newbie and she performed better without my help,
James Ayetemimowa
[email protected]
[email protected]
All the Indicators:
EMA Crossover Signal.mq4
BreakOut-EAGLE_indicator.mq4
Pivot Points Multitimeframe.mq4
DYNAMIC_Breakout_Daily_Range_v10.mq4
Additional indicators (Swing Recognition)
Demark_trend_new.mq4
Mouteki.mq4
The template for 1hr and 15min tf
Edward Revy,
http://forex-strategies-revealed.com/
Copyright © Forex Strategies Revealed


Edward, How can you change the setting in the EMA Crossover Signal indicator ? (change setting of 6EMA to open)
I cannot see how to do it in the box where I set the indicator
Rams, take a look here:
http://forex-indicators.net/mt4-indicators/breakout_panca_eagle
Please explain break out eagle indicator, How to make profit in this case.
Rams
my question is if this works on a 1 hour timeframe entry what about the daily weekly or monthly?
Yes, you'll need to change the settings to close and open.
Kind regards,
Edward
Hi i just notice that MA settings are 5ema(close-red), 6ema(Open-blue).
The EMA Crossover Signal indicator attached is set to both(close).
Do i need to change?
Thanks for this strategy.
Thanks a lot dear.........
hello lee yatt from malaysia ,
can i get your email address
shuk
Breakout-Eagle? no.
Alex
does it repains?
Hi Neil,
Right click anywhere on the chart. From the pop-up menu select "Properties..."
Go to menu "Common"
You should see the following window:
Use "Chart on foreground" feature to bring charts forward.
Best regards,
Edward
Hi,
When using the template the MA run behind the bars so it is very difficult to see whether they have crossed or not when they are behind a bar.
does anybody know how to get the MA to show over the top of the bars?
Many Thanks
Neil
It's used for trend confirmation, although we have no specific rules associated with it here. Leave it up, and see if it can be of any help to you when trading.
Best regards,
Edward
Where does the 20ema come into it?
Thanks :)
Post new comment